Data diodes guarantee unidirectional communication and ensure that data traffic in the network, no matter what type of media is used, can only flow in one direction.
Unidirectional network devices with data diode functionality are typically used to ensure information security or protection of critical digital systems (CRITIS), such as industrial control systems or production networks from cyber attacks.
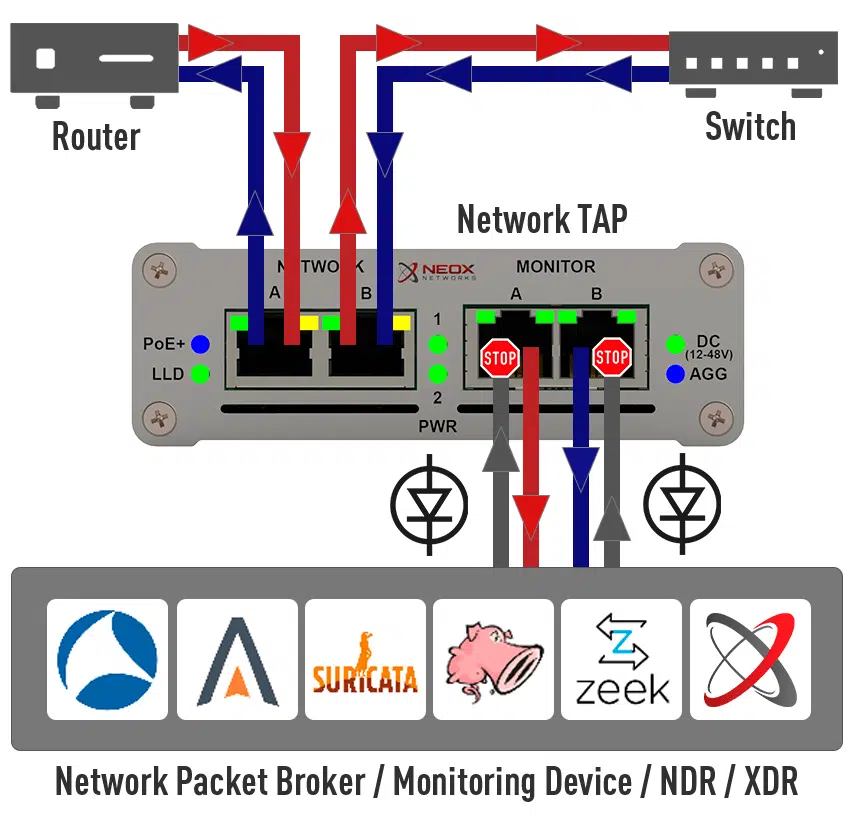
This data diode function is crucial in a Network TAPs (Test Access Points) as it helps to ensure that network traffic only flows in the intended direction and that any unauthorised access of the network is prevented, helping to prevent data tampering and leakage.
Data Diode Function with active Network TAPs
By allowing data to flow in only one direction, a data diode ensures that sensitive or confidential information on the network cannot be viewed or stolen by unauthorised users. This is especially important for organisations that handle sensitive data, such as financial institutions and government agencies.
Another important advantage of the data diode function in Network TAPs is that it helps prevent malicious attacks on the network, for example.
The unidirectional flow of data means that a data diode can prevent hackers from accessing the network and installing malware or other malicious software. This in turn helps protect the network from a variety of threats, including viruses, ransomware and denial-of-service attacks.
In summary, the data diode function is an important component in Network TAPs as it is instrumental in ensuring the security and integrity of network traffic. Since it only allows data flow in one direction without any retroactive effect, it can prevent data breaches and malicious attacks and improve the availability of the network.
Conclusion
Companies that handle sensitive data should consider integrating the data diode function into their Network TAPs to ensure their network security.
In my current article, I would like to discuss the topic of network access using Network TAP and show you the advantages of this technology.
Nowadays, networks are the core element for the transport of communication data and the exchange of electronic information. The number of network-enabled products is increasing rapidly and the medium of the Internet has long since become an integral part of our lives. In the home sector, too, manufacturers are relying more and more on network-capable elements, thus enabling users to have convenient access (to such devices) regardless of their location.
Life without the internet is hardly imaginable and today’s computer networks are very important.
But what happens if the network fails or is not available in the usual way?
The impact of a network failure can have huge financial consequences and may well cause worldwide chaos. With a proactive monitoring system, you can continuously monitor your IT service quality and thus significantly minimise the risk of a failure. Permanent monitoring of your IT infrastructure also helps you with investment decisions, as you can obtain detailed analyses and evaluations from the information obtained and thus derive trends. Especially when it comes to capacity planning or ensuring QoS (Quality of Service), comprehensive monitoring is indispensable.
A network monitoring system is not an off-the-shelf product and this article is about network monitoring using the so-called “packet capture” method. With this method, all network data to be analysed is evaluated byte by byte. The transmitted digital information is recorded by means of capturing and analysed by the monitoring tool.
But where does this data come from and how reliable are these sources of information?
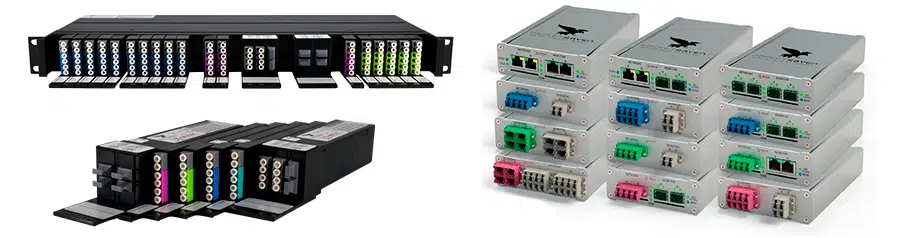
Network Taps are best suited for this measurement technique. What are these devices and how are they used? Network Taps usually have four physical ports and are transparently looped into the network line to be analysed. The information transmitted on the network ports is mirrored on the monitoring interfaces.
This technique provides a 100% insight into the network events and allows the data to be analysed without affecting the network performance. Since every single transmitted network packet is copied out of the line, one would also be able to create a “backup” of one’s network data with this method.
Technical advantages of Network TAPs:
Network Taps do not impair the function of the active network line at all
100% transparent and invisible to hackers and other attackers
Network Taps are passive and behave like a cable bridge (fail-closed) in case of failure
Network packets with CRC errors are also routed out
Non-compliant data according to IEEE 802.3 are copied out
Works protocol-independent and supports jumbo frames
Classic network taps forward the data in full-duplex mode
Overbooking of output ports excluded
No tedious configuration required, once installed it delivers the desired data
Errors due to incorrect packet order excluded
Configuration errors excluded, as commissioning is done by Plug’n Play
Media-converting Network Taps available for the widest possible range of applications
If you have performance problems in the network or already have a failure, fast action is usually called for. In such situations, you have little time to configure SPAN ports and want to start troubleshooting immediately. But what if there is no SPAN port available at the time or the password to the switch is not at hand? But it can also be much worse, namely that the switch is busy due to a DDoS attack or a bandwidth-intensive application, making analysis on the SPAN port virtually impossible.
It could also happen that the switch is not available in the usual way due to a malicious attack. Especially for security reasons or to detect industrial espionage, network taps are indispensable, as they emit data at the physical level, regardless of what is happening in the network, and thus always allow reliable network analysis and monitoring.
How to save monitoring resources with Packet Slicing and comply with legal requirements
Problem
Often the gap between the capacity of the recording analysis system on the one hand and the amount of incoming data on the other is so large that without appropriate additional mechanisms the analysis system is most likely not able to record all individual packets without loss.
Depending on the purpose of the analysis system, this is a major problem, as every packet counts, especially in the cyber security environment, and otherwise it is not possible to ensure that all attacks and their effects are detected.
Attacks that are not detected in time or even remain completely invisible can cause enormous damage to companies, even leading to recourse claims from possible insurers if they discover that their clients did not fulfil their duty of care.
But how does such a situation arise? It can happen very quickly that networks in companies grow, often in parallel with the business development of this company, while the often already existing analysis and monitoring systems, planned with reserves during procurement, reach the end of their reserves more and more often.
Higher bandwidths, more and more services and interfaces used in the LAN reduce the capacities to the point where the systems can no longer keep up and have to discard packets.
From this moment on, it is theoretically possible for an attacker to stay undetected in the local network, as the analysis system is hopelessly overloaded. The administrator is no longer able to see which parties in his network are talking to each other, which protocols they are using and which endpoints are being communicated with outside the LAN.
Often, however, it is not capacity problems that trigger the activation of Packet Slicing, but rather data protection reasons. Depending on where and which data is tapped and when, it may be obligatory for the company to only record and evaluate data that does not contain any personal or performance-related information.
While typically the packet header only contains connection data (WHEN, WHO, HOW, WHERE), the payload data, although usually encrypted, contains the very content data that theoretically makes it possible to measure the performance of individual users. Depending on the place of use, however, this is often neither wanted nor allowed. It must therefore be ensured that it is not possible for the administrator to reconstruct personal information from the recorded data.
Reduce analysis data by means of Packet Slicing
And this is exactly where the “Packet Slicing” feature comes into play: with this procedure it is possible to reduce the incoming data load on your analysis system by up to 87% (with 1518 bytes packet size and Packet Slicing at 192 bytes) by simply removing the user data from each packet.
Many analysis and monitoring approaches only need the information stored in the packet header, i.e. the metadata, for their evaluations and analyses, while the user data often does not contain any important or usable information, as this is usually encrypted anyway and thus cannot be used for the evaluation. By removing the user data, a massive relief of the processing instance is to be expected, and in some cases this enables even greater coverage of the LAN by the monitoring and analysis device.
FCS Checksum Problem
An important aspect of Packet Slicing is the recovery of the FCS checksum of each modified packet. Since the structure and length of the packet is affected by cutting away the user data, the originally calculated checksum, which was calculated by the sender and entered in the FCS field of the packet header, is no longer correct.
As soon as such a packet arrives on the analysis system, those packets are discarded or declared erroneous, as the checksum in the FCS field is still based on the original packet length. To counteract this, it is essential that the FCS checksum is recalculated and also entered for each packet from which the user data has been removed, as this would otherwise force the analysis systems to classify these packets as faulty and/or manipulated.
Network Packet Broker as a Packet Slicer
In general, there are several possibilities where the above-mentioned Packet Slicing can be activated in the visibility platform used by the customer. On the one hand, this is a case-by-case decision, on the other hand, it is also a technical one.
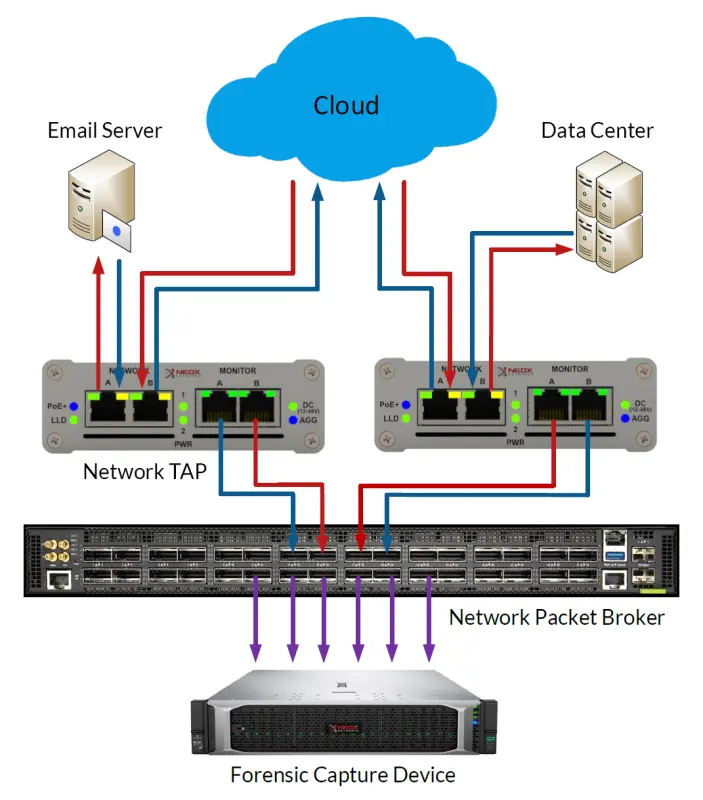
Assuming that the user has set several measuring points distributed in his network, a Network Packet Brokeris often used. This device is another level of aggregation and is typically used as the last instance directly before the monitoring system. A Network Packet Broker is optically very close to a switch and enables the user to centrally combine the data from multiple measuring points (Network TAPs or SPAN ports) and send them aggregated in one or more data streams to the central analysis system.
Thus, for example, the data from 10 distributed measuring points set in 1 Gigabit lines can be sent to an analysis system with a single 10 Gigabit port by the Network Packet Broker aggregating these 1 Gigabit signals and outputting them again as a single 10 Gigabit signal.
At this point, however, the user learns of a catch to the whole issue: often the analysis systems, although equipped with a 10Gigabit connection, are not able to process bandwidths of 10Gigabit/second as well.
This can have a variety of reasons, which, however, should not be the subject of this blog entry. However, the initial situation is predestined for the use of Packet Slicing; while one would normally have to expand one’s monitoring infrastructure at immense cost, by switching on Packet Slicing one can massively reduce the incoming flood of data and thus continue to use one’s existing systems; all that is needed is a corresponding instance with precisely this feature, which usually costs only a fraction of what would be estimated for an upgrade of the analysis systems.
Analysis Systems as Packet Slicers
Another possibility is offered to the user on the analysis systems themselves. Depending on the manufacturer, structure and components used, it is possible to directly remove the user data on the systems themselves and recalculate the checksum before the packets are passed on internally to the corresponding analysis modules.
In the vast majority of cases, an FPGA-based network card is required for this, as it must be ensured that no CPU-based resource is used to modify each individual packet. Only by means of pure hardware capacities can the user be sure that every packet is really processed accordingly; any other approach could again lead to the errors and problems mentioned at the beginning.
Packet Slicing to meet Legal Requirements
Another aspect worth mentioning is the fulfilment of legal requirements. Especially in the context of the GDPR, it may be necessary to remove the user data, as often the metadata is sufficient for an analysis.
For example, if you want to analyse VoIP, you can use Packet Slicing to ensure that unauthorised persons cannot listen to the conversation, but you can still technically evaluate the voice transmission and examine it for quality-of-service features. This allows performance values to be evaluated, privacy to be protected and legal requirements such as the GDPR to be met.
Conclusion
So we see that there are indeed different ways to distribute the final load on the analysis and monitoring systems or even, as in this example, to reduce it without losing the most important information for creating performance charts, top talkers and more. Packet Slicing is therefore a valid solution for the user, which can be easily implemented in almost all cases and achieves usable results.
It wasn’t that long ago that enterprises housed their critical business applications exclusively in their own networks of servers and client PCs. Monitoring and troubleshooting performance issues, such as latency, was easy to implement.
Although network monitoring and diagnostics tools have greatly improved, the introduction of a multitude of interconnected SaaS applications and cloud-hosted services has greatly complicated typical network configuration, which can have a negative impact.
As companies outsource more and more applications and data hosting to external providers, this introduces weaker and weaker links into the network. SaaS services are generally reliable, but without a dedicated connection, they can only be as good as the Internet connection they use.
From a network management perspective, the secondary issue with externally hosted apps and services is that the IT team has less control and visibility, making it more difficult for service providers to stay within their service level agreements (SLAs).
Monitoring network traffic and troubleshooting within the relatively controlled environment of an enterprise headquarters, is manageable for most IT teams.
But for organizations based on a distributed business model, with multiple branch offices or employees in remote locations, using dedicated MPLS lines quickly leads to high costs.
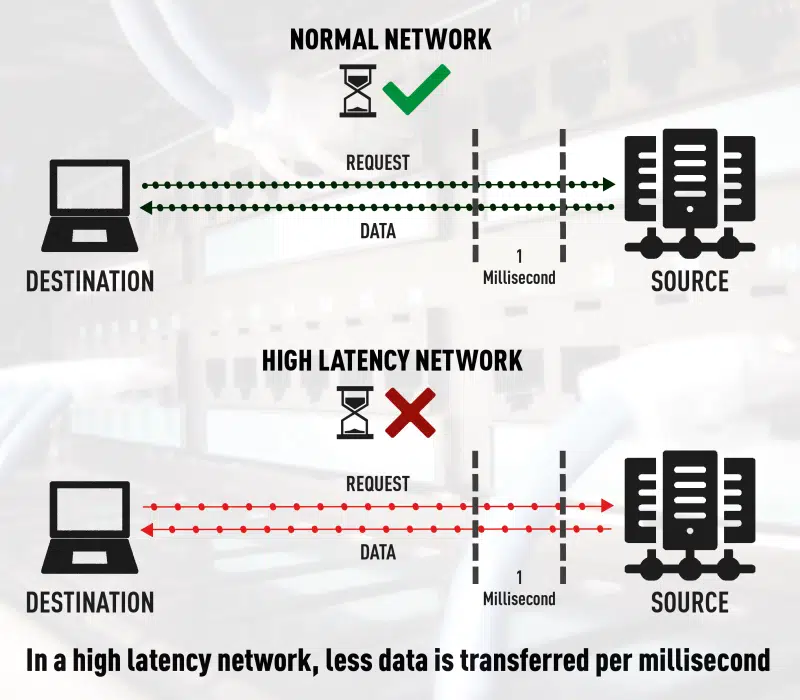
Difference between normal and high network latency
When you consider that traffic from applications like Salesforce, Skype for Business, Office 365, Citrix and others, typically bypass the main office, it’s not surprising that latency is becoming more common and increasingly difficult to troubleshoot.
One of the first victims of latency is VoIP call quality, which manifests itself in unnatural delays in phone calls. However, with the explosive growth of VoIP and other UCaaS applications, this problem will continue to grow.
Another area where latency takes its toll is data transfer speeds. This can lead to a number of problems, especially when transferring or copying large data files or medical records from one location to another.
Latency can also be an issue for large data transactions, such as database replication, as more time is required to perform routine activities.
Impact of decentralized networks and SaaS
With so many connections to the Internet, from so many locations, it makes sense for enterprise network performance monitoring to be done out of the data center. One of the best approaches is to find tools that monitor connections at all remote sites.
Most of us use applications like Outlook, Word and Excel almost every day. If we’re using Office 365, those applications are likely configured to connect to Azure, not the enterprise data center.
If the IT team doesn’t monitor network performance directly at the branch office, they completely lose sight of the user experience (UX) at that location. You may think the network is working fine, when in fact users are frustrated because of a previously undiagnosed problem.
When traffic from SaaS providers and other cloud-based storage providers is routed to and from an enterprise, it can be negatively impacted by jitter, trace route, and sometimes compute speed.
This means that latency becomes a very serious limitation for end users and customers. Working with vendors that are close to the data needed is one way to minimize potential issues due to distance. But even in a parallel process, you may have thousands or millions of connections trying to get through at once. Although this results in a rather small delay, they build up and become larger over long distances.
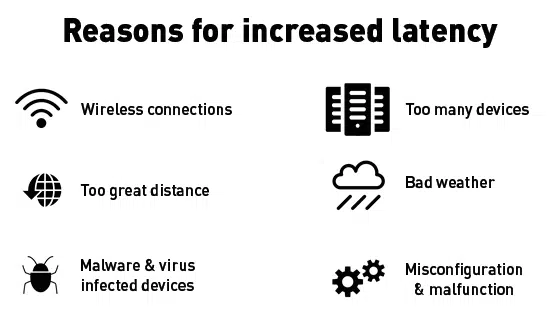
Reasons for network latencies
Is machine learning the answer to high network latency?
It used to be that each IT team could define and monitor clear network paths between its enterprise and data center. They could control and regulate applications running on internal systems because all data was installed and hosted locally without accessing the cloud.
This level of control provided better insight into issues such as latency and allowed them to quickly diagnose and fix any problems that may arise.
Almost ten years later, the proliferation of SaaS applications and cloud services has now complicated network performance diagnostics to the point where new measures are needed.
What is the cause of this trend? The simple answer is added complexity, distance and lack of visibility. When an organization transfers its data or applications to an external provider instead of hosting them locally, this effectively adds a third party into the mix of network variables.
Each of these points leads to a potential vulnerability that can impact network performance. While these services are, for the most part, quite stable and reliable, outages in one or more services do occur, even among the industry’s largest, and can impact millions of users.
The fact is that there are many variables in a network landscape that are out of the control of enterprise IT teams.
/p>One way companies try to ensure performance is to use a dedicated MPLS tunnel leading to their own corporate headquarters or data center. But this approach is expensive and most companies do not use this method for their branch offices. As a result, data from applications such as Salesforce, Slack, Office 365 and Citrix will no longer be transferred through the enterprise data center because they are no longer hosted there.
To some extent, latency can be mitigated by using traditional methods to monitor network performance, but latency is inherently unpredictable and difficult to manage.
But what about artificial intelligence? We’ve all heard examples of technologies that are making great strides using some form of machine learning. Unfortunately, however, we are not at the point where machine learning can significantly minimize latency.
We cannot predict exactly when a particular switch or router will be overloaded with traffic. The device may experience a sudden burst of data, causing a delay of only one millisecond or even ten milliseconds. The fact is, once these devices are overloaded, machine learning cannot yet help with these sudden changes to prevent queues of packets waiting to be processed.
Currently, the most effective solution is to tackle latency where it affects users the most – as close to their physical location as possible.
In the past, technicians used Netflow and/or a variety of monitoring tools in the data center, knowing full well that most of the traffic was getting to their server and then returning to their customers. With such a much larger distribution of data today, only a small portion of the data makes it to the servers, which makes monitoring your own data center far less efficient.
Rather than relying solely on such a centralized network monitoring model, IT teams should supplement their traditional tools by monitoring data connections at each remote site or branch office. Compared to current practices, this is a change in mindset, but it makes sense: if data is distributed, network monitoring must be distributed as well.
Applications like Office 365 and Citrix are good examples, as most of us use productivity and unified communications tools on a regular basis. These applications are more likely to be connected to Azure, AWS, Google or others, rather than the company’s own data center. If the IT team is not actively monitoring this branch, they will completely lose sight of the user experience at this location.
Choose a comprehensive and appropriate approach
Despite all the benefits of SaaS solutions, latency will continue to be a challenge unless enterprise IT teams rethink their approach to network management.
In short, they need to take a comprehensive, decentralized approach to network monitoring that encompasses the entire network and all its branches. Better ways to monitor the user experience and improve it as needed must also be found.
Focus on the user experience
There is no doubt that the proliferation of SaaS tools and cloud resources has been a boon for most enterprises. However, the challenge for IT teams now is to rethink the approach to network management in a decentralized network. An important issue is certainly the ability to effectively monitor that SLAs (service level agreements) are being met. Even more important, however, is the ability to ensure quality of service for all end users.
To achieve this, IT professionals need to see exactly what users are experiencing in real time.
This transition to a more proactive monitoring and troubleshooting style helps IT professionals resolve network or application bottlenecks of any kind before they become problematic for employees or customers.
Conclusion
Ergo, in order to ensure the lowest possible latencies and an associated optimal user experience, monitoring based on central measuring points is no longer sufficient in most cases.
While monitoring can still remain centralized, the measuring points must be increasingly decentralized.
How do I distribute my network traffic for analysis as effectively as possible using load balancing?
Problem
Often, analysis, monitoring and security systems have more than one port to accept and process incoming data from the corresponding network access points. Many of these systems have at least 2, 4 or even more ports ready to accept data.
Depending on the type and location of the various network access points, this offers the user the option of providing a dedicated physical port per tapped line. However, several factors are a prerequisite for this.
The speed and topology of the network lines to be analysed must be identical to the connections of the analysis system and it must be ruled out that further tap points are added in the future which are to be evaluated by the same analysis system.
Approaches
Apart from the problems with speeds and topologies, additional analysis systems can of course be installed at any time should the number of lines to be monitored increase.
However, this is often the most costly and time-consuming alternative. Besides the necessary procurement, it would mean for the user to deal with yet another system; an avoidable additional administrative effort.
To avoid such a situation, there are various options and, depending on the setup already in place, technical procedures can be used to distribute the incoming data from the measuring points more effectively to the physical ports already in place.
In many cases, it is primarily the ratio of data volume and number of measurement points to the number of available ports on the analysis system and not the basic amount of data volume that can lead to bottlenecks of a physical nature.
Both (semi-dynamic) load balancing and dynamic load balancing can help here, a feature that most network packet brokers include.
Here, a group/number of physical ports is combined on the Network Packet Broker and defined as a single logical output instance. Data streams that leave the Network Packet Broker via this port grouping are distributed to all ports that are part of this grouping, but the individual sessions remain intact.
Example
Let us assume the following example: 8 measuring points have been set distributed in the local network. A session between 2 end points runs via each tap point. The analysis system used is equipped with a total of 4 ports for data acquisition.
Even if one assumes that the measuring points are exclusively SPAN or mirror ports, there is still the problem that too many measuring points meet too few ports.
And this is where Network Packet Brokers with Load Balancing come into play. Load Balancing ensures that each session between 2 end points of each measuring point is sent as a whole to a single port of the connected analysis system.
For simplicity, assume that the 8 sessions of the 8 measuring points are distributed equally among the 4 ports of the analysis system, 2 sessions per port.
This is all completely dynamic and subsequently added sessions between endpoints are sent fully automatically to the ports of the analysis system that belong in the port grouping. It is not necessary to set up or change the configuration of the Network Packet Broker afterwards; the built-in automatisms allow the automated and reliable distribution of further data streams to the analysis system.
Of course, it is also possible to connect additional tap points to the Network Packet Broker and have their data included in the Load Balancing, as well as to expand the above-mentioned port grouping with additional output ports.
All these steps can be taken during operation, the additional data streams are distributed to the newly added ports of the analysis system in real time without interruptions.
Removing ports, even during operation, is no problem either! The Network Packet Broker is able to ensure that the packets/sessions are forwarded to the remaining ports of the analysis system without any loss of time or packets.
Sessions & Tuples
But how can the Network Packet Broker ensure that entire sessions are always distributed on the individual ports of the load balancing group mentioned above?
For this purpose, a hash value is generated from each individual package. An integrated function ensures that in the case of bi-directional communication, the packets of both transport directions leave the Network Packet Broker again on the same port.
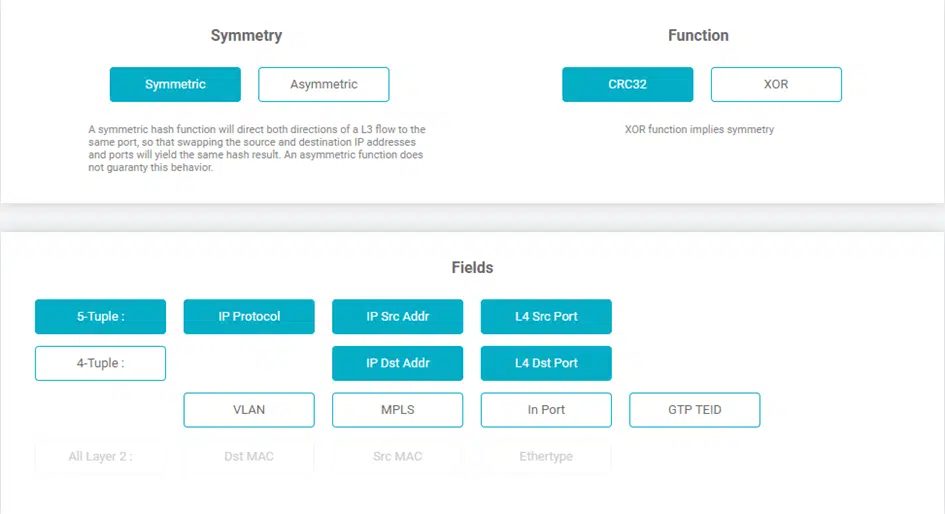
These hash values are determined using the so-called “5-tuple” mechanism, where each tuple represents a specific field in the header of each Ethernet frame. The available tuples on the Network Packet Broker (e.g. NEOXPacketLion), which are used for dynamic Load Balancing, are:
Input Port (Physical Connection)
Ethertype
Source MAC
Destination MAC
VLAN Label
MPLS Label
GTP Tunnel Endpoint Identifier
GTP Inner IP
IP Protocol
Source IP
Destination IP
Layer-4 Source PORT
Layer-4 Destination PORT
Depending on the structure and setup of the network, and depending on whether packets are transported using NAT, another very common distribution of tuples is:
IP Protocol
Source IP
Destination IP
Layer-4 Source PORT
Layer-4 Destination PORT
With “5-tuple” based Load Balancing, all the above-mentioned tuples are used to form a hash value which ensures that all packets, including the corresponding reverse direction, always leave the Network Packet Broker via the same port and thus, for example, the security system used always and fundamentally only receives complete sessions for evaluation.
Hash Values
In order to be able to generate the actual hash value on which the Load Balancing is based, the user has two different functions at his disposal, CRC32 and XOR.
By means of the CRC32 function, hash keys with a length of 32 bits can be generated and can be used both symmetrically and asymmetrically, while the XOR function creates a 16-bit long hash key, which, depending on the intended use, allows a higher-resolution distribution of the data, but can only output it symmetrically.
This symmetry means that even if the source IP and destination IP are swapped, as is known from regular Layer 3 conversations, the function still calculates the same hash key and thus the full Layer 3 conversations always leave the Network Packet Broker on the same physical port.
In the case of an asymmetric distribution, which is only supported by the CRC32 function, the Network Packet Broker PacketLion would calculate different hash values in the situation described above and thus also be output accordingly on different physical ports.
NEOXPacketLion Network Packet Broker – Screenshot
Dynamic Load Balancing
Another, additional function of Load Balancing is the possible dynamics with which this feature can be extended. In the case of dynamic Load Balancing, in addition to the hash value explained above, the percentage utilisation of each port that is part of the Load Balancing port group is also included in the calculation.
Of course, this procedure does not split any flows, and it also ensures that if a flow is issued based on the calculations on a specific port, this flow will always leave the Network Packet Broker via the same port in the future.
By means of a configurable timeout, the user can define when a flow loses its affiliation to an output port. In the event of a recurrence, this is then output to the participants of the load-balancing port group again in a regular manner and, both by detecting the load in the TX stream and by means of the hash value generation, it is determined which output port of the Network Packet Broker is currently most suitable for bringing the data to the connected analysis system.
Conclusion
It turns out that distributing the incoming data load by means of load balancing has been an effective way of utilising security, analysis and monitoring systems for many years. Over the years, this process has been further improved and culminates in the Dynamic Load Balancing that the PacketLion series has.
Constantly following up the configuration with regard to the distribution of the individual sessions to the connected systems is no longer necessary; this is now taken over by the intelligence of the Network Packet Broker and allows the user to use the full potential of his systems and avoid unnecessary expenditure.


 Another aspect worth mentioning is the fulfilment of legal requirements. Especially in the context of the