They tell the truth unless they are recorded incorrectly. In these cases, packets can indeed tell bold-faced lies.
When searching trace files, we may come across symptoms in the packets that would make many a person frown in surprise. These are events that seem strange on the surface and can even distract our troubleshooting for a time. Some of these issues have actually misled network analysts for hours, if not days, causing them to chase issues and events that simply do not exist on the network.
Most of these examples can be easily avoided by capturing packets from a network Test Access Point (TAP) rather than on the machine where the traffic is generated. With a network TAP, you can capture the network data transparently and unaltered, and see what is really being transmitted over the wire.
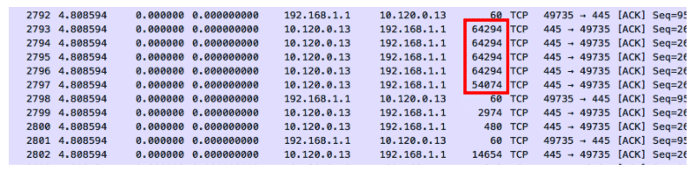
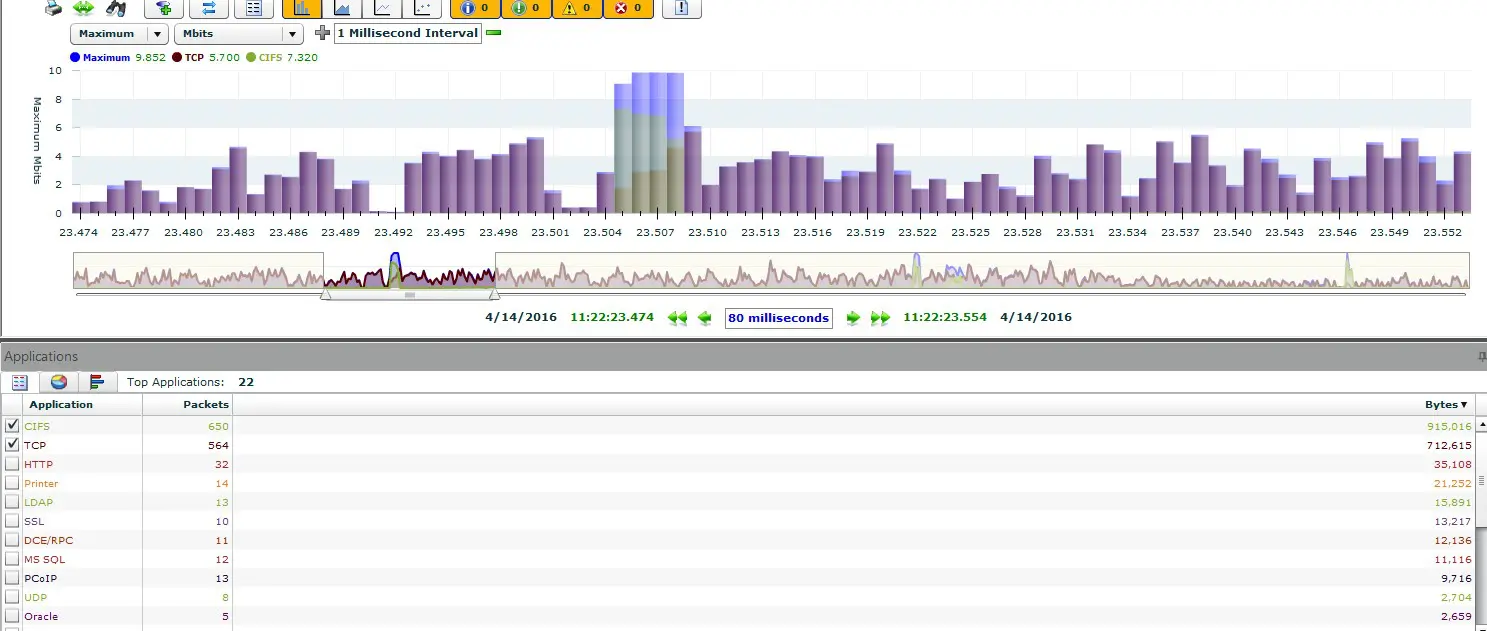
In most cases, packets should not be larger than the Ethernet maximum of 1518 bytes, or what is specified for the link MTU. However, this is only true if we are not using 802. 1Q tags or are in a jumbo frame environment.
How is it possible to have packets larger than the Ethernet maximum? Simply put, we capture them before they are segmented by the NIC. Many TCP/IP stacks today use TCP Segmentation Offload, which delegates the burden of segmenting packets to the NIC. The WinPcap or Libpcap driver captures the packets before this process takes place, so some of the packets may appear far too large to be legitimate.
If the same activity was captured on the network, these large frames would be segmented into several smaller ones for transport.
Zero Delta Zeiten
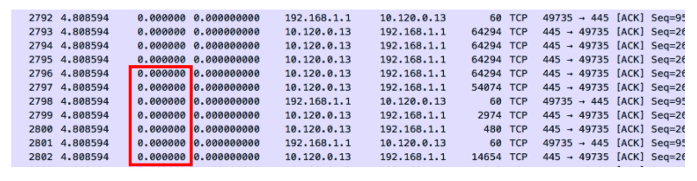
Zero delta times means that there is no measured time between the packets. When these parcels enter the capture device, they receive a time stamp and a measurable delta time. The entry timestamp on the capture device could not keep up with the volume of packets. On the other hand, if these packets were captured with an external tap server, we could probably get an error-free timestamp.
Previous packets not captured
This warning is displayed because Wireshark has noticed a gap in the TCP data stream. It can determine from the sequenced numbers that a packet is missing. Sometimes this is justified due to upstream packet loss. However, it may also be a symptom that the analyser or SPAN has dropped the packet because it could not keep up with the load.

After this warning, you should look for a series of duplicate ACK packets instead of a defective packet. This indicates that a packet has actually been lost and needs to be retransmitted. If you do not see retransmission or defective packets, the analyzer or SPAN probably could not keep up with the data stream. The packet was actually on the network, but we didn’t see it.
TCP ACKed unnoticed segments
In this case, an acknowledgement is displayed for a data packet that was not detected. The data packet may have taken a different path, or the capturing device may simply not have noticed it.
Recently I have seen these events on trace files captured by switches, routers and firewalls. Since capturing traffic is a lower priority than forwarding (thank goodness!), the device may simply miss some of the frames in the data stream. Having seen the acknowledgement, we know that the packet has made it to its destination.
For the most part, packets tell the truth. They can lead us to the root cause of our network and application problems. Because they present such clear and detailed data, it is very important that we record them as close to the network as possible. This means that we need to capture them during transmission, rather than on the server itself. This helps us not to waste time with false negatives.
If you want to learn more about network visualisation considerations for professionals, download our free infographic, TAP vs SPAN.