A microburst is a local and sudden downburst (downdraft) within a thunderstorm, usually with a diameter of 4 km, although this is usually much smaller. Microbursts can cause significant damage to the surface and in some cases can even be life-threatening.
In computer networks, a microburst is defined as a brief rush of data that typically lasts only milliseconds, but which overloads the link (Ethernet, Gigabit, 10 Gigabit, etc.). A microburst is a serious concern for any network because even a short term network overload means that some users will not be able to access the network. Because the industry standard for measuring network usage is displayed in bits per second (bps), microbursts often go undetected because they are compensated for during the measurement process. In most cases, traditional network monitoring systems do not report such congestion because it is not present for more than a full second.
The end-user’s experience can be significantly limited if there is too much network traffic or performance bottlenecks caused by a slow data flow or connection failure.
Identifying a microburst requires accurate measurement of network traffic on a link with a microsecond granularity and visualisation in milliseconds. Here is a practical example of how to identify a microburst.
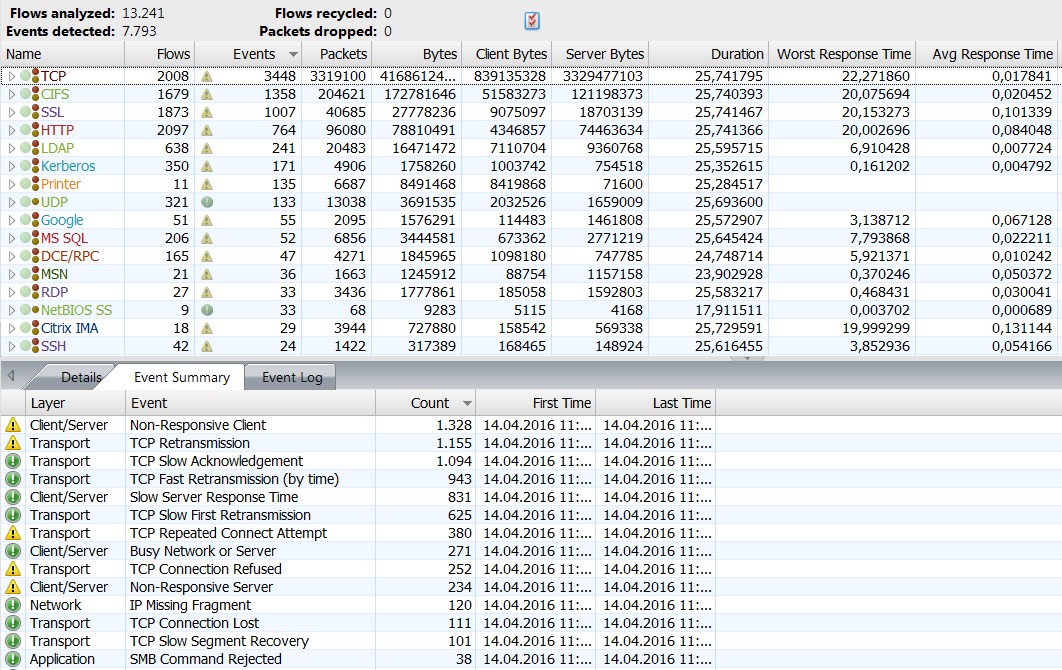
In this example, the measurement point is on a TAP inserted into a 10 Gbit/s link on a data centre link. We measured 45 seconds of network traffic using a Liveaction Omnipliance TL. Omnipeek’s expert system immediately alerts on irregularities on OSI layers 2 to 7. These alerts can be sorted based on any of the available columns, e.g. by number, layers, etc. In this case, we sort by number and are thus able to identify TCP retransmissions, “non-responsive” peer alerts, slow acknowledgements, etc.
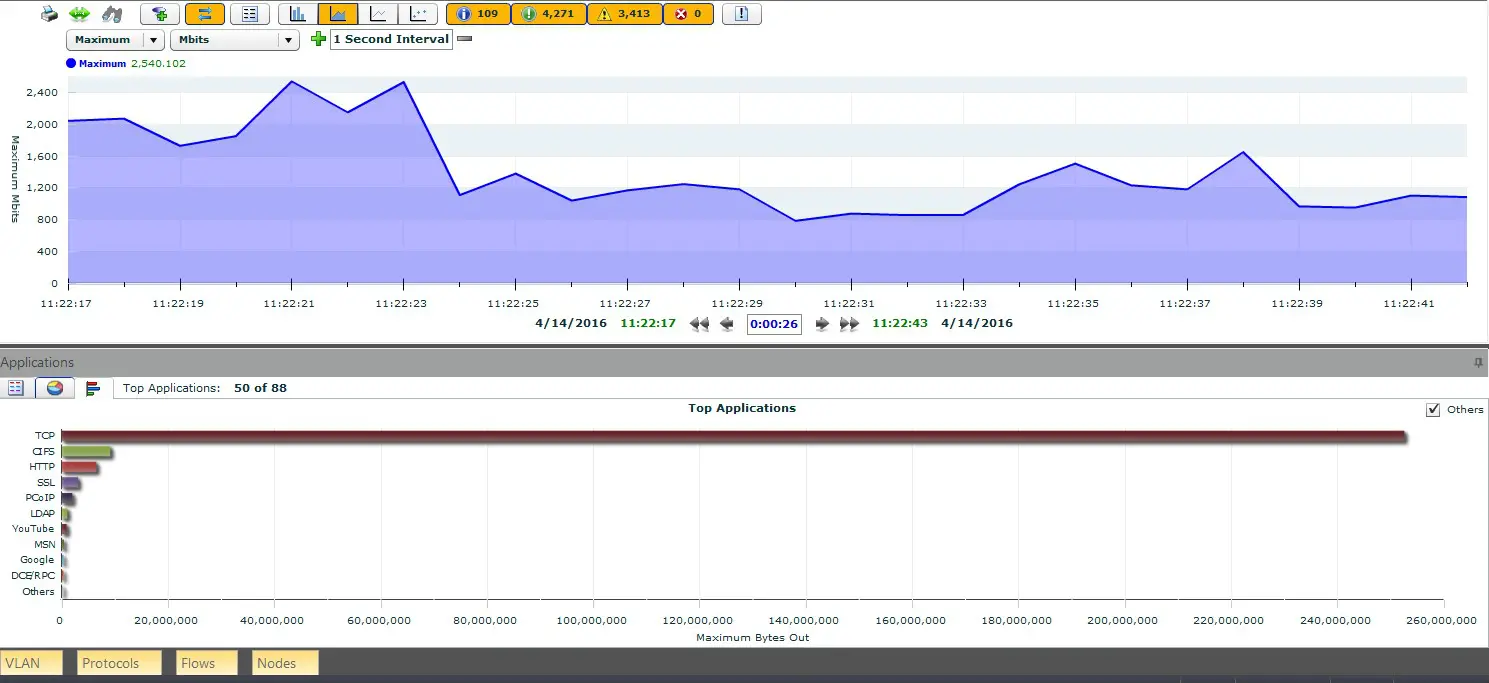
When the network load is plotted using typical bps, as is the case in Figure 2, the maximum full duplex peak is 2.54 Gbps, which is not considered a concern for a 10 Gbps connection with a full duplex capacity of 20 Gbps (transmit and receive – 10 Gbps in each direction).
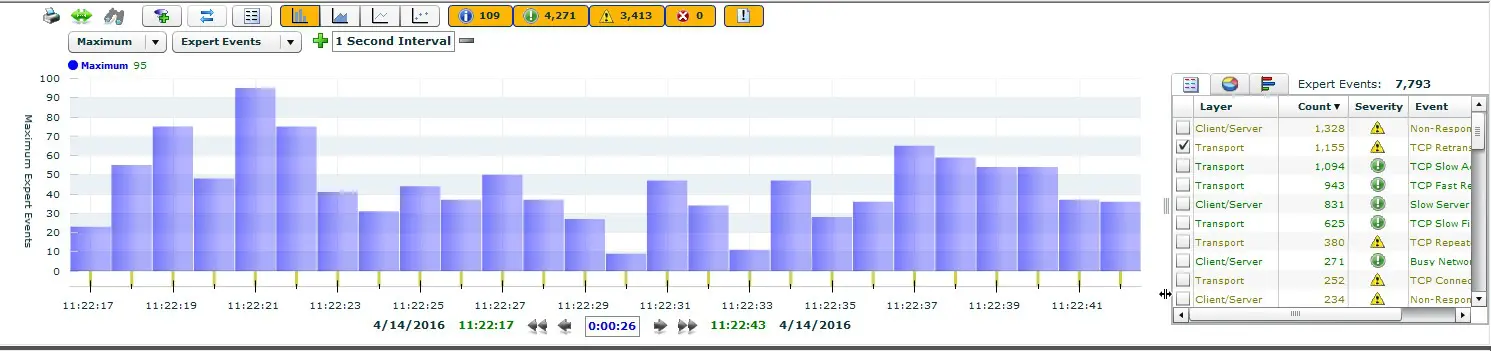
One thing we noticed in the Compass Expert Event summary is that there are quite a large number of events associated with slow network problems, especially when measured at 45 seconds. Compass can graph the occurrence of Expert Events, which shows that there is a commonality in the slope relationship between Expert Events and overall network utilisation:
Since the number of slow network events is quite large, let’s go back to the usage graph to examine the peaks a little more closely. We can do a deeper analysis to thereby see a level of detail in milliseconds, where we could see several spikes of up to 9,845 Mbit per millisecond. Converted to seconds (simply multiplied by 1000), this would be 9.845 Gbps, and should this go in one direction, this will fully utilise our 10 Gig link.
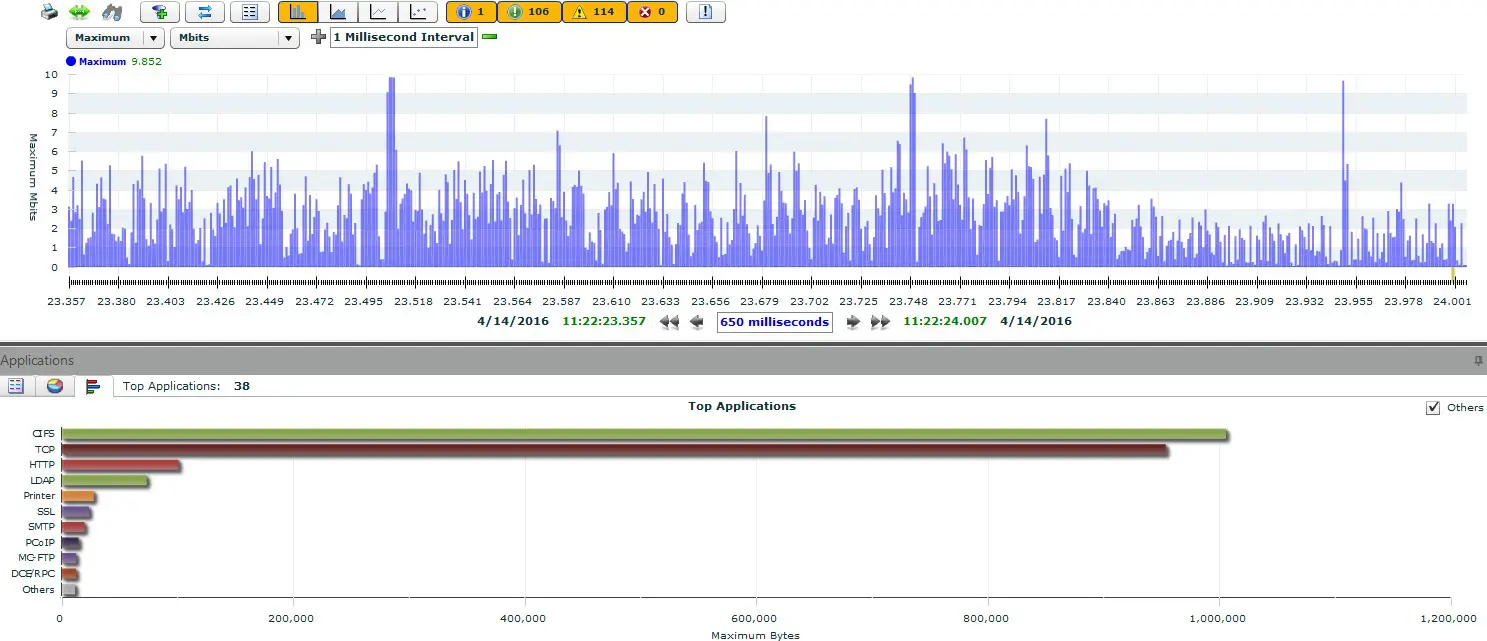
Interestingly, in Figure 4, the upper protocol has been changed to CIFS. So what happened?
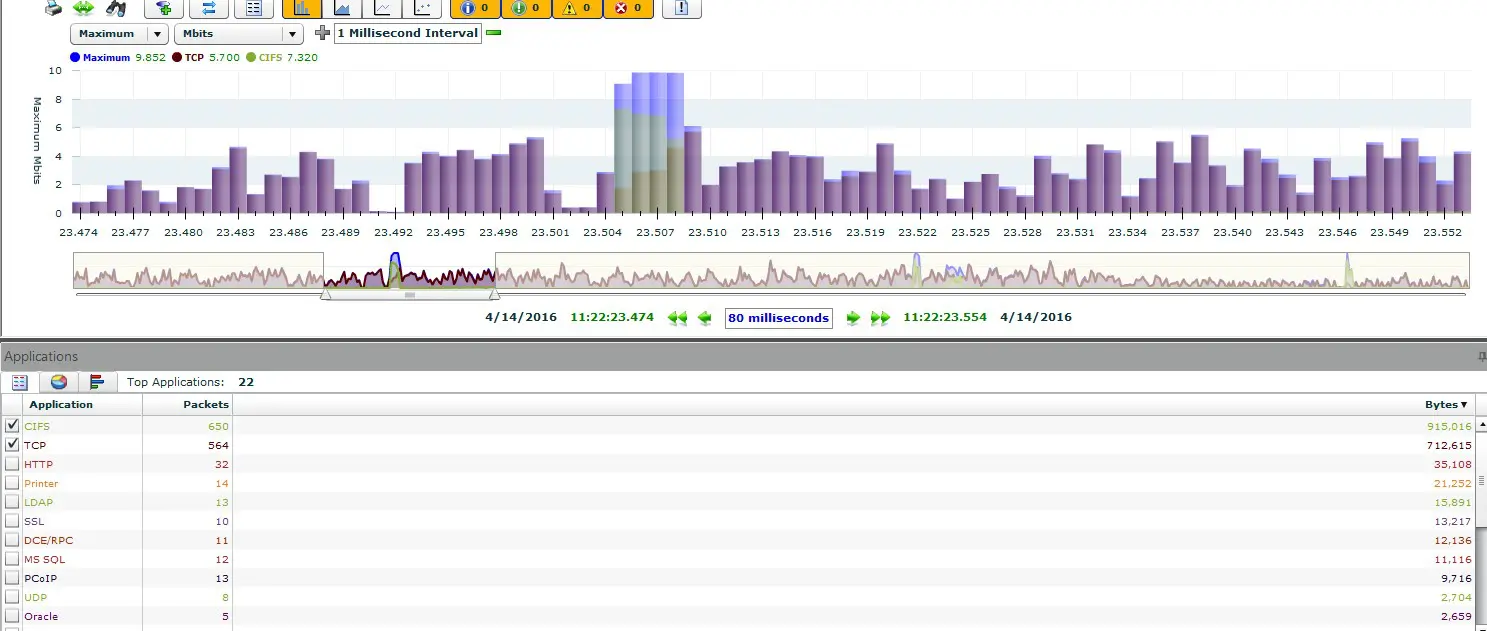
With a normal utilisation of up to 6 Mbit per millisecond of TCP traffic, CIFS spikes of up to 6 Mbit per millisecond can increase the utilisation even to 12 Mbit per millisecond, which exceeds the capacity of a 10 Gbit/s link in one direction altogether. In such a situation, the switches are no longer able to buffer the traffic until the bursts are gone, causing packets to be lost and ultimately causing TCP retransmissions, which the Expert Events clearly demonstrate.
Liveaction Omnipeek provides a very intuitive and cost-effective way to check if microbursts are actually occurring on your network, but also when, where and how much network performance is suffering. If you would like to try a free 30-day trial of Omnipeek today, simply visit our website.