Author Archives: Timur Özcan

Network TAP vs. SPAN Port

netzwerk-tap_vs_span-port

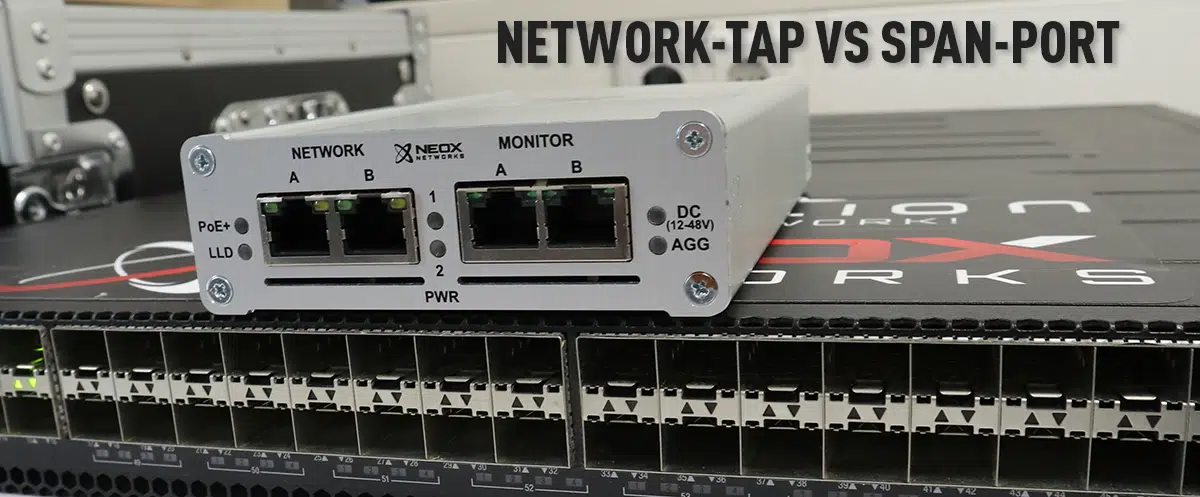
In my current article, I would like to discuss the topic of network access using Network TAP and show you the advantages of this technology.

Nowadays, networks are the core element for the transport of communication data and the exchange of electronic information. The number of network-enabled products is increasing rapidly and the medium of the Internet has long since become an integral part of our lives. In the home sector, too, manufacturers are relying more and more on network-capable elements, thus enabling users to have convenient access (to such devices) regardless of their location.

Life without the internet is hardly imaginable and today’s computer networks are very important.

But what happens if the network fails
or is not available in the usual way?

Network Monitoring

The impact of a network failure can have huge financial consequences and may well cause worldwide chaos. With a proactive monitoring system, you can continuously monitor your IT service quality and thus significantly minimise the risk of a failure. Permanent monitoring of your IT infrastructure also helps you with investment decisions, as you can obtain detailed analyses and evaluations from the information obtained and thus derive trends. Especially when it comes to capacity planning or ensuring QoS (Quality of Service), comprehensive monitoring is indispensable.

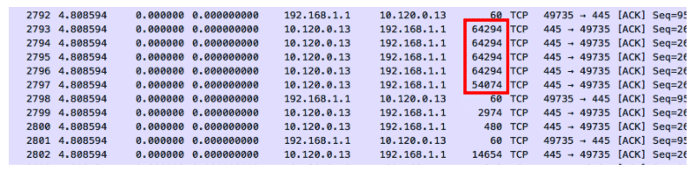
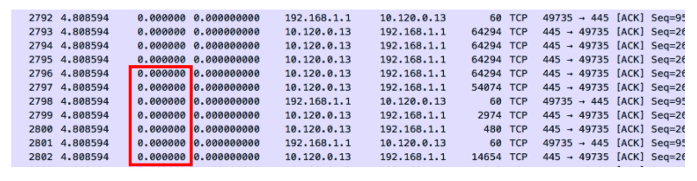
A network monitoring system is not an off-the-shelf product and this article is about network monitoring using the so-called “packet capture” method. With this method, all network data to be analysed is evaluated byte by byte. The transmitted digital information is recorded by means of capturing and analysed by the monitoring tool.

But where does this data come from and how reliable are these sources of information?

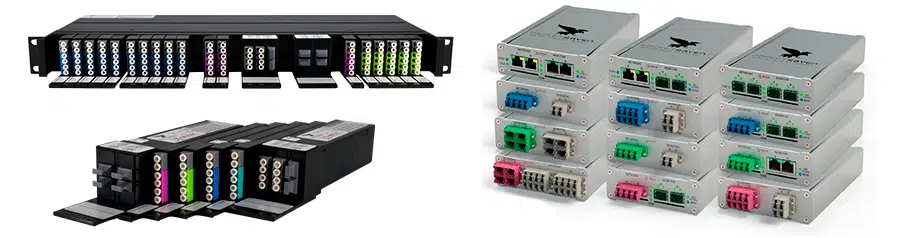
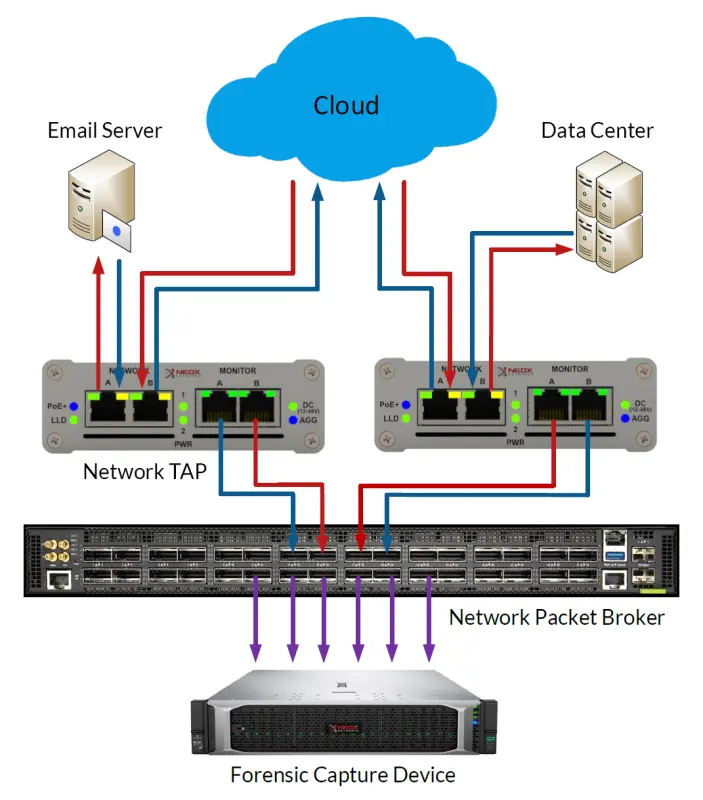
Network Taps are best suited for this measurement technique. What are these devices and how are they used? Network Taps usually have four physical ports and are transparently looped into the network line to be analysed. The information transmitted on the network ports is mirrored on the monitoring interfaces.

This technique provides a 100% insight into the network events and allows the data to be analysed without affecting the network performance. Since every single transmitted network packet is copied out of the line, one would also be able to create a “backup” of one’s network data with this method.

Technical advantages of Network TAPs:

  • Network Taps do not impair the function of the active network line at all
  • 100% transparent and invisible to hackers and other attackers
  • Network Taps are passive and behave like a cable bridge (fail-closed) in case of failure
  • Completely transmits the network data
  • The integrity of the data is guaranteed
  • 100% reaction-free due to galvanic isolation (Data Diode Function)
  • Network packets with CRC errors are also routed out
  • Non-compliant data according to IEEE 802.3 are copied out
  • Works protocol-independent and supports jumbo frames
  • Classic network taps forward the data in full-duplex mode
  • Overbooking of output ports excluded
  • No tedious configuration required, once installed it delivers the desired data
  • Errors due to incorrect packet order excluded
  • Configuration errors excluded, as commissioning is done by Plug’n Play
  • Media-converting Network Taps available for the widest possible range of applications

If you have performance problems in the network or already have a failure, fast action is usually called for. In such situations, you have little time to configure SPAN ports and want to start troubleshooting immediately. But what if there is no SPAN port available at the time or the password to the switch is not at hand? But it can also be much worse, namely that the switch is busy due to a DDoS attack or a bandwidth-intensive application, making analysis on the SPAN port virtually impossible.

It could also happen that the switch is not available in the usual way due to a malicious attack. Especially for security reasons or to detect industrial espionage, network taps are indispensable, as they emit data at the physical level, regardless of what is happening in the network, and thus always allow reliable network analysis and monitoring.

Application examples of Network TAPs:

Network Forensics and Data Capturing
Example – Network TAPs for forensic analysis

Conclusion

There are many reasons to use Network TAPs and we hope that we have been able to give you an overview of the benefits in this article.

Keeping latencies in check – using decentralized measuring points

Dezentralisierte-Messpunkte mittels Netzwerk-TAPs

It wasn’t that long ago that enterprises housed their critical business applications exclusively in their own networks of servers and client PCs. Monitoring and troubleshooting performance issues, such as latency, was easy to implement.

Although network monitoring and diagnostics tools have greatly improved, the introduction of a multitude of interconnected SaaS applications and cloud-hosted services has greatly complicated typical network configuration, which can have a negative impact.

As companies outsource more and more applications and data hosting to external providers, this introduces weaker and weaker links into the network. SaaS services are generally reliable, but without a dedicated connection, they can only be as good as the Internet connection they use.

From a network management perspective, the secondary issue with externally hosted apps and services is that the IT team has less control and visibility, making it more difficult for service providers to stay within their service level agreements (SLAs).

Monitoring network traffic and troubleshooting within the relatively controlled environment of an enterprise headquarters, is manageable for most IT teams.

But for organizations based on a distributed business model, with multiple branch offices or employees in remote locations, using dedicated MPLS lines quickly leads to high costs.

Normal vs high Network Latency
Difference between normal and high network latency

When you consider that traffic from applications like Salesforce, Skype for Business, Office 365, Citrix and others, typically bypass the main office, it’s not surprising that latency is becoming more common and increasingly difficult to troubleshoot.

One of the first victims of latency is VoIP call quality, which manifests itself in unnatural delays in phone calls. However, with the explosive growth of VoIP and other UCaaS applications, this problem will continue to grow.

Another area where latency takes its toll is data transfer speeds. This can lead to a number of problems, especially when transferring or copying large data files or medical records from one location to another.

Latency can also be an issue for large data transactions, such as database replication, as more time is required to perform routine activities.

Impact of decentralized networks and SaaS

With so many connections to the Internet, from so many locations, it makes sense for enterprise network performance monitoring to be done out of the data center. One of the best approaches is to find tools that monitor connections at all remote sites.

Most of us use applications like Outlook, Word and Excel almost every day. If we’re using Office 365, those applications are likely configured to connect to Azure, not the enterprise data center.

If the IT team doesn’t monitor network performance directly at the branch office, they completely lose sight of the user experience (UX) at that location. You may think the network is working fine, when in fact users are frustrated because of a previously undiagnosed problem.

When traffic from SaaS providers and other cloud-based storage providers is routed to and from an enterprise, it can be negatively impacted by jitter, trace route, and sometimes compute speed.

This means that latency becomes a very serious limitation for end users and customers. Working with vendors that are close to the data needed is one way to minimize potential issues due to distance. But even in a parallel process, you may have thousands or millions of connections trying to get through at once. Although this results in a rather small delay, they build up and become larger over long distances.

6 Reasons for increased latency
Reasons for network latencies

Is machine learning the answer to high network latency?

It used to be that each IT team could define and monitor clear network paths between its enterprise and data center. They could control and regulate applications running on internal systems because all data was installed and hosted locally without accessing the cloud.

This level of control provided better insight into issues such as latency and allowed them to quickly diagnose and fix any problems that may arise.
Almost ten years later, the proliferation of SaaS applications and cloud services has now complicated network performance diagnostics to the point where new measures are needed.

What is the cause of this trend? The simple answer is added complexity, distance and lack of visibility. When an organization transfers its data or applications to an external provider instead of hosting them locally, this effectively adds a third party into the mix of network variables.

Each of these points leads to a potential vulnerability that can impact network performance. While these services are, for the most part, quite stable and reliable, outages in one or more services do occur, even among the industry’s largest, and can impact millions of users.

The fact is that there are many variables in a network landscape that are out of the control of enterprise IT teams.

/p>One way companies try to ensure performance is to use a dedicated MPLS tunnel leading to their own corporate headquarters or data center. But this approach is expensive and most companies do not use this method for their branch offices. As a result, data from applications such as Salesforce, Slack, Office 365 and Citrix will no longer be transferred through the enterprise data center because they are no longer hosted there.

To some extent, latency can be mitigated by using traditional methods to monitor network performance, but latency is inherently unpredictable and difficult to manage.

But what about artificial intelligence? We’ve all heard examples of technologies that are making great strides using some form of machine learning. Unfortunately, however, we are not at the point where machine learning can significantly minimize latency.

We cannot predict exactly when a particular switch or router will be overloaded with traffic. The device may experience a sudden burst of data, causing a delay of only one millisecond or even ten milliseconds. The fact is, once these devices are overloaded, machine learning cannot yet help with these sudden changes to prevent queues of packets waiting to be processed.

Currently, the most effective solution is to tackle latency where it affects users the most – as close to their physical location as possible.

In the past, technicians used Netflow and/or a variety of monitoring tools in the data center, knowing full well that most of the traffic was getting to their server and then returning to their customers. With such a much larger distribution of data today, only a small portion of the data makes it to the servers, which makes monitoring your own data center far less efficient.

Rather than relying solely on such a centralized network monitoring model, IT teams should supplement their traditional tools by monitoring data connections at each remote site or branch office. Compared to current practices, this is a change in mindset, but it makes sense: if data is distributed, network monitoring must be distributed as well.

Applications like Office 365 and Citrix are good examples, as most of us use productivity and unified communications tools on a regular basis. These applications are more likely to be connected to Azure, AWS, Google or others, rather than the company’s own data center. If the IT team is not actively monitoring this branch, they will completely lose sight of the user experience at this location.

Choose a comprehensive and appropriate approach

Despite all the benefits of SaaS solutions, latency will continue to be a challenge unless enterprise IT teams rethink their approach to network management.
In short, they need to take a comprehensive, decentralized approach to network monitoring that encompasses the entire network and all its branches. Better ways to monitor the user experience and improve it as needed must also be found.

Focus on the user experience

There is no doubt that the proliferation of SaaS tools and cloud resources has been a boon for most enterprises. However, the challenge for IT teams now is to rethink the approach to network management in a decentralized network. An important issue is certainly the ability to effectively monitor that SLAs (service level agreements) are being met. Even more important, however, is the ability to ensure quality of service for all end users.

To achieve this, IT professionals need to see exactly what users are experiencing in real time.
This transition to a more proactive monitoring and troubleshooting style helps IT professionals resolve network or application bottlenecks of any kind before they become problematic for employees or customers.

Conclusion

Ergo, in order to ensure the lowest possible latencies and an associated optimal user experience, monitoring based on central measuring points is no longer sufficient in most cases.

While monitoring can still remain centralized, the measuring points must be increasingly decentralized.

Emotet Malware: Email Spoofer Awakening

According to IBM X-Force, the Emotet malware has recently been spreading in Germany and Japan, targeting companies in the area more and more aggressively.

Emotet is a banking Trojan spread by macro-enabled email attachments that contain links to malicious sites. It functions primarily as a downloader for other malware, namely the TrickBot Trojan and Ryuk ransomware. Due to its polymorphic nature, it can evade traditional signature-based detection methods, making it particularly difficult to combat. Once it has infiltrated a system, it infects running processes and connects to a remote C&C server to receive instructions, run downloads and upload stolen data (us-cert.gov).

Traditionally, Emotet has been using corporate billing notifications for disguise, often mimicking the branding of reputable institutions to make itself appear legitimate. This strategy allowed it to target victims in the USA (52 % of all attacks), Japan (22 %) and countries of the EU (japan.zdnet.com). An incident that took place in December 2019 caused the city of Frankfurt, home of the European Central Bank, to shut down its network (zdnet.com).

In Japan, however, the malware has been acting with much greater aggression compared to the past years. Increased activity was reported in late 2019, and recently, following the coronavirus outbreak in China, Emotet had a change of tactics and has now been spreading throughout Japan in the form of fake public health warnings with disturbing reports of coronavirus cases in the Gifu, Osaka and Tottori prefectures (IBM X-Force Exchange).

This is a good illustration of what makes this type of malware so dangerous – not only is it resistant to detection by signature-based methods, it also manipulates basic human emotion to disseminate itself.

Protection against Emotet therefore requires more complex measures. Besides well-informed prevention, an effective way to cope with it is to rely on behavior analysis seeking indicators of compromise (IoC). In Flowmon’s case, this takes the form of the InformationStealers behavior pattern (BPattern), which exists as a standard detection method in Flowmon ADS and describes the symptoms of Emotet’s presence in the network.

BPatterns can be thought of as a kind of description of how different malicious actors manifest themselves in the network. They allow the system to discern threats from other activity as it monitors and critically assesses the traffic. Unlike traditional signatures, BPatterns do not look for a particular piece of code and thus retain their ability to identify threats even as they transform and progress through their life-cycle.

According to an analysis published by Fortinet, Emotet uses 5 URLs to download payload and 61 hard-coded C&C servers (fortinet.com/blog). This information is included in the BPattern, and is used by the system to recognize the infection and contain it before it can spread. For an added layer of protection, there is a BPattern for TrickBot as well (TOR_Malware). Both patterns are periodically updated depending on how the Trojans evolve and are delivered to users as part of regular updates. It was Flowmon’s partner Orizon Systems that alerted us to the increased incidence of the Emotet malware and prompted the most recent update.

But no protection is infallible and everyone is advised to keep several layers of cyber protection in place and up to date – including antivirus, IoC detection on firewalls, intrusion detection systems (IDS) and behavioral analysis on the network. Because Emotet spreads by spoofed email, users should exercise caution opening attachments, especially those who come in daily contact with bills and documents from outside parties, and report any suspicious or unusual email to the security team.

To learn more about threat detection using Flowmon ADS, contact us for more information or try a demo.

Ethernet packets don’t lie – well, at least in most cases

They tell the truth unless they are recorded incorrectly. In these cases, packets can indeed tell bold-faced lies.

When searching trace files, we may come across symptoms in the packets that would make many a person frown in surprise. These are events that seem strange on the surface and can even distract our troubleshooting for a time. Some of these issues have actually misled network analysts for hours, if not days, causing them to chase issues and events that simply do not exist on the network.

Most of these examples can be easily avoided by capturing packets from a network Test Access Point (TAP) rather than on the machine where the traffic is generated. With a network TAP, you can capture the network data transparently and unaltered, and see what is really being transmitted over the wire.

Very large packets

In most cases, packets should not be larger than the Ethernet maximum of 1518 bytes, or what is specified for the link MTU. However, this is only true if we are not using 802. 1Q tags or are in a jumbo frame environment.

How is it possible to have packets larger than the Ethernet maximum? Simply put, we capture them before they are segmented by the NIC. Many TCP/IP stacks today use TCP Segmentation Offload, which delegates the burden of segmenting packets to the NIC. The WinPcap or Libpcap driver captures the packets before this process takes place, so some of the packets may appear far too large to be legitimate.

If the same activity was captured on the network, these large frames would be segmented into several smaller ones for transport.

Zero Delta Zeiten

Zero delta times means that there is no measured time between the packets. When these parcels enter the capture device, they receive a time stamp and a measurable delta time. The entry timestamp on the capture device could not keep up with the volume of packets. On the other hand, if these packets were captured with an external tap server, we could probably get an error-free timestamp.

Previous packets not captured

This warning is displayed because Wireshark has noticed a gap in the TCP data stream. It can determine from the sequenced numbers that a packet is missing. Sometimes this is justified due to upstream packet loss. However, it may also be a symptom that the analyser or SPAN has dropped the packet because it could not keep up with the load.

After this warning, you should look for a series of duplicate ACK packets instead of a defective packet. This indicates that a packet has actually been lost and needs to be retransmitted. If you do not see retransmission or defective packets, the analyzer or SPAN probably could not keep up with the data stream. The packet was actually on the network, but we didn’t see it.

TCP ACKed unnoticed segments

In this case, an acknowledgement is displayed for a data packet that was not detected. The data packet may have taken a different path, or the capturing device may simply not have noticed it.

Recently I have seen these events on trace files captured by switches, routers and firewalls. Since capturing traffic is a lower priority than forwarding (thank goodness!), the device may simply miss some of the frames in the data stream. Having seen the acknowledgement, we know that the packet has made it to its destination.

For the most part, packets tell the truth. They can lead us to the root cause of our network and application problems. Because they present such clear and detailed data, it is very important that we record them as close to the network as possible. This means that we need to capture them during transmission, rather than on the server itself. This helps us not to waste time with false negatives.

If you want to learn more about network visualisation considerations for professionals, download our free infographic, TAP vs SPAN.

Thank you for your upload

Skip to content