| Valkyrie Test Modules |
||||
| P/N in ValkyrieBay | Port Speeds | Interface Form Factor | No. of Ports | Type of Interface |
| 1GE |
||||
| Odin-1G-3S-6P-T1-RJ45 | 1GE / 100M | RJ45 | 6 ports | 100/1000BASE-T |
| Odin-1G-3S-6P | 1GE / 100M / 10M | SFP | 6 ports | 10/100/1000BASE-T |
| Odin-1G-3S-6P-E | 1GE / 100M / 10M | SFP | 6 ports | 1000BASE-X / 100BASE-FX/BX |
| 10GE |
||||
| Odin-10G-1S-6P | 10G | SFP+ | 6 ports | 10GBASE-SR/LR/ER/DAC |
| Odin-10G-4S-2P-COMBI | 1G/10G | SFP/SFP+ | 6 ports | 10/100/1000M BASE-T & 10GBASE-SR/LR/ER/DAC |
| Odin-10G-5S-6P-CU | 10GE 5GE 2.5GE 1GE 100M |
RJ45 | 6 ports | 10GBASE-T 1000BASE-T 100BASE-T |
| Odin-10G-6S-6P | 10GE 5GE 2.5GE 1GE 100M |
SFP+ | 6 ports | 10GBASE-SR/LR/ER/DAC |
| 100GE |
||||
| Loki-100G-5S-2P | 100G (or) 50G (or) 40G (or) 25G (or) 10G (or) 25G (or) 10G |
QSFP28 / QSFP+ | 2 ports | 100GBASE-SR4/LR4/CWDM4/CR4 50GBASE-SR2/LR2/CR2 40GBASE-SR4/LR4/CR4 25GBASE-SR/LR/CR 10GBASE-iSR 25GBASE-SR/LR/CR 10GBASE-SR/LR/CR |
| 400GE |
||||
| Thor-400G-7S-1P 7-speed dual-media |
400G (or) 200G (or) 200G (or) 100G (or) 100G (or) 50G (or) 50G (or) 40G (or) 25G (or) 10G (or) |
QSFPDD QSFPDD/QSFP56 QSFPDD QSFPDD/QSFP56 QSFP28 QSFPDD/QSFP56 QSFP28 QSFP28/QSFP+ QSFP28 QSFP28/QSFP+ |
1 port 2 port 1 port 4 port 2 port 8 ports 4 ports 2 ports 8 ports 8 ports |
400GBASE-FR8/LR8 200GBASE-DR4/SR4/FR4/LR4/CR4/CWDM4 200GBASE-CR8 100GBASE-SR2/CR2/DR 100GBASE-SR4/LR4/CR4 50GBASE-SR/FR/LR/CR 50GBASE-SR2/LR2/CR2 40GBASE-SR4/LR4/CR4 25GBASE-SR/LR/CR 10GBASE-iSR |
| 800GE |
||||
| Freya-800G-4S-1P 4-speed dual-media |
800G (or) 400G (or) 200G (or) 100G (or) |
QSFP-DD800 QSFP-DD800/QSFP112 QSFP-DD800/QSFP112 QSFP-DD800/QSFP112 |
1 Port 2 Port/1 Port, 4 Port/2 Port, 8 Port/4 Port |
800GBASE-SR8/FR8/LR8 400GBASE-FR8/LR8 200GBASE-DR4/SR4/FR4/LR4/CR4/CWDM4 / 200GBASE-CR8 100GBASE-SR2/CR2/DR / 100GBASE-SR4/LR4/CR4 |
| * includes advanced timing features for testing SyncE ** Only available in XenaCompact chassis |
||||
Portable & Modular Ethernet Test- and Analysis Appliance
for 1G, 10G, 40G, 100G, 200G, 400G and 800G Networks

The Quick Version
With Valkyrie, Ethernet can generate Layer 2-3 traffic at speeds of up to 800 Gbps, and then analyze how the network devices and services are responding.
Valkyrie is flexible, scalable and easy to integrate. The test platform offers extreme accuracy and the best test automation options on the market.
In addition, the prices are very attractive. To receive an offer, simply use this form. Or scroll down to learn more.
Overview – Valkyrie L2-3 Test Platform
The Valkyrie Layer 2-3 test platform is used to configure and generate Ethernet traffic with a high level of accuracy and granularity, and then analyze how network devices and services perform in response.
Valkyrie offers a choice of two chassis that can be equipped with an extensive range of copper and optical Gigabit Ethernet test modules supporting all Ethernet speeds up to 800GE including the new 2.5GE, 5GE, 25GE and 50GE speeds.

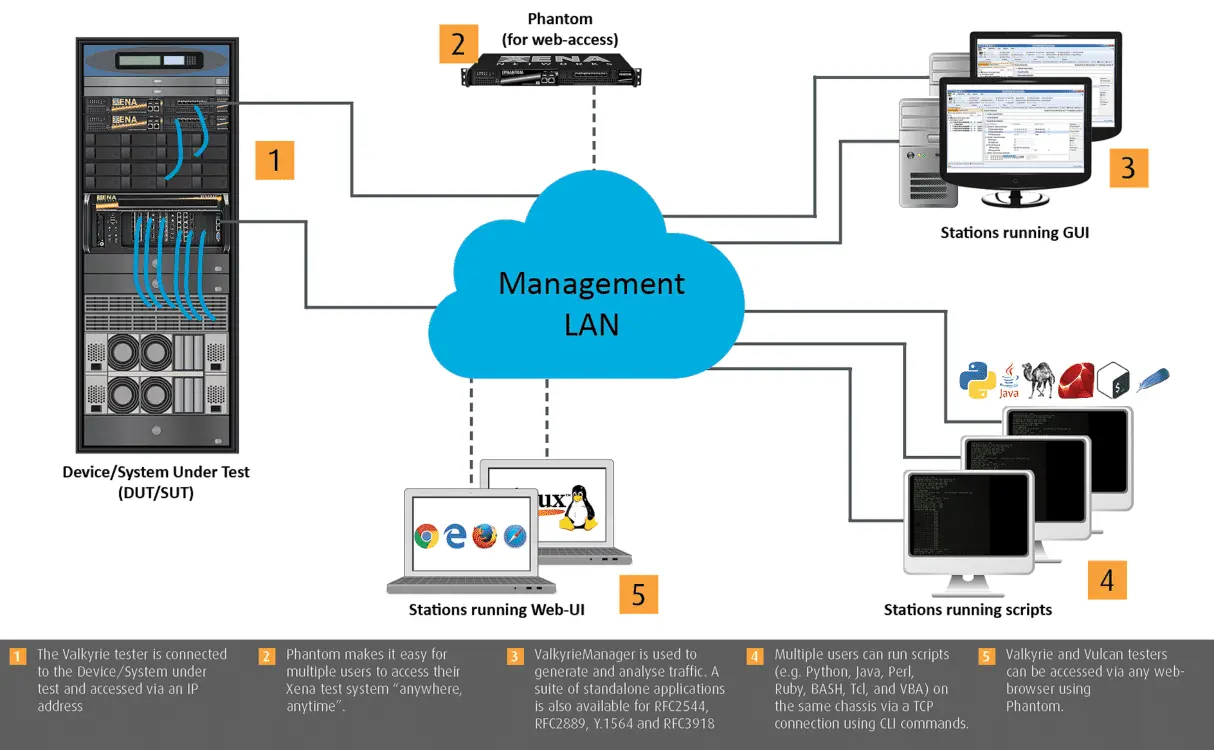
The chassis and test modules are controlled via ValkyrieManager, a Windows GUI client provided for ad-hoc test execution, and remote management of test equipment located in multiple locations. Also included are standalone applications for automated RFC 2544, Y.1564, RFC 2889 and RFC 3918 testing.
Finally, an open TCP/IP-based text API lets users automate testing from any software environment, using Tcl, Python, Perl, VBA and Java wrappers to convert to/from the generic Xena Command Line Interface (CLI) format.
Valkyrie is used by hundreds of customers worldwide who value its range of features, ease-of-use, cost efficiency, interoperability, and scalability.
Very fast and super friendly
The Valkyrie L2-3 test platform is the industry’s easiest to deploy. Here are some examples:
- The software is native to Windows, and can be freely downloaded from the Internet. Double-click to launch, enter an IP address and a password, and you are ready to test.
- Centralized upgrades make it quick and easy to install the latest software across multiple testers for immediate access to the newest features and bug fixes.
- All devices can be administered from the same user-friendly GUI to ensure fast, efficient testing – without the big learning curve that go with our competitors’ products.
- To make remote testing even easier, Xena offers Phantom – a browser-based (HTML5) user-interface that lets engineers access their test system from any OS.
- Valkyrie test solutions are also ready for virtualization ensuring low-cost future-proof migration to cloud-based testing.
Valkyrie L2-3 Hardware
Two chassis – multiple options
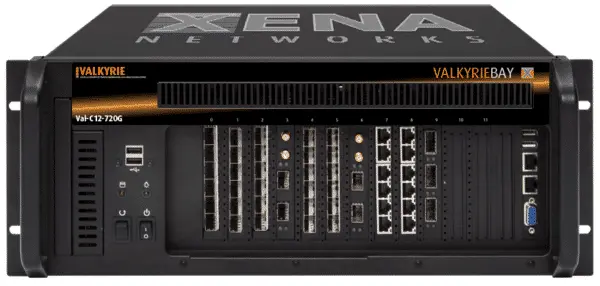
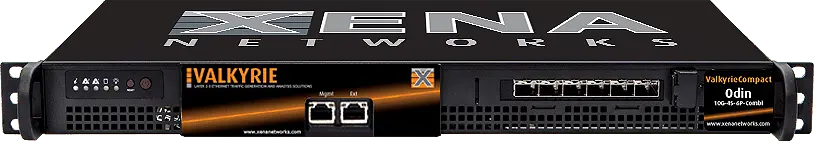
Valkyrie includes a range of advanced test modules for testing all speeds from 1GE up to 800GE – and beyond. These test modules can be mounted in either of Xena’s hardware chassis – the easy-to-transport ValkyrieCompact (with one fixed slot), or the 4U ValkyrieBay which has 12 modular slots. The test modules support a variety of interfaces (SFP+, QSFP, CFP4, CXP etc.) and many are uniquely capable of handling multiple speeds via simple software settings.
One ValkyrieBay can hold up to:
- 6 x 800 GigE (SR8/DR4/FR8/LR8)
- 6 x 400 GigE (DR4/FR8/LR8)
- 6 x 200 GigE (DR4/SR4/FR4/LR4/CR4)
- 6 x 100 GigE (LR4/SR4/CDWM4/SR10/CR4)
- 12 x 50 GigE LR2/SR2 optical, CR2 electrical
- 24 x 40 GigE QSFP+ (or 6 x LR4 / 12 x SR4) ports
- 24 x 25GigE LR/SR optical, CR electrical
- 144 x 10 GigE copper/optical ports
- 72 x 5 GigE copper ports
- 72 x 2.5 GigE copper ports
- 72 x GigE copper/optical ports
One ValkyrieCompact can hold up to:
- 1 x 400 GigE (DR4/FR8/LR8)
- 1 x 200 GigE (DR4/SR4/FR4/LR4/CR4)
- 2 x 100 GigE (LR4/SR4/CDWM4/ SR10/CR4)
- 2 x 50-GigE LR2/SR2 optical, CR2 electrical
- 1 (LR4) / 2 (SR4) / 2 (QSFP+) x 40-GigE
- 4 x 25G LR/SR optical, CR electrical
- 6 x 10-GigE copper/optical ports
- 6 x 5 GigE copper ports
- 6 x 2.5 GigE copper ports
- 6 x GigE copper/optical ports


Valkyrie Layer 2 – 3

ValkyrieBay

ValkyrieManager

ValkyrieCompact
Test all Gigabit Ethernet speeds
Valkyrie can test all Ethernet speeds up to 800GE, including both 25GE / 50GE, and 2.5GE / 5GE.
Many data centers are now transitioning to 25GE as a cost-effective upgrade for their existing 10GE links. The challenge for enterprises is to boost connection speeds of overburdened WiFi access points by using 2.5GE & 5GE while leveraging their legacy Cat5E cabling.
Both of these scenarios require test solutions that Valkyrie is capable of meeting at a highly competitive price/point.
Valkyrie L2-3 Software
Included with all our hardware is a valuable portfolio of software. In addition to the core ValkyrieManager application and ScriptingCLI, Xena offers standalone test suites (see below) which can be easily automated.
We also include 3 years’ free software maintenance and the option for extending licensing subsequently.

ValkyrieManager
ValkyrieManager is a Windows-based application used to configure and generate streams of Ethernet traffic between Xena test equipment and devices under test (DUTs) at all speeds up 800Gbps, and analyze the results. This is the software you’ll use most of the time.

Valkyrie1564
Valkyrie1564 makes it easy to validate Ethernet service-level agreements (SLAs) in a single test per Y.1564. It supports multiple protocols per UNI (Ethernet, Customer and Service VLANs, MPLS, IPv4, IPv6, and UDP) and you can define Per-UNI or per-CoS bandwidth profiles, and specify CoS-to-DSCP mapping.

ValkyrieScripting
ValkyrieScripting is a command-line-interface (CLI) scripting API with hundreds of scriptable parameters to make test automation easier. Any client platform can be used (e.g. Tcl, Perl, Python, Java, Ruby and VBA). XenaScripting supports multiple concurrent scripting sessions by different users in different locations.

Valkyrie3918
Valkyrie3918 makes it easy to do advanced IP multicast network testing using various framesizes, either as in-test variations or as multiple testruns each using a fixed frame size. Unicast and multicast traffic can be configured to use the exact protocol headers needed. All fields in the protocol headers can be modified.

Valkyrie2544
Valkyrie2544 fully supports the 4 test-types specified in RFC2544. There are extensive configuration options, support for single stream and multi-stream testing and you can define protocol layers supported by the test (Ethernet, Customer and Service VLANs, IP and UDP) precisely the way you want.
Valkyrie2889
Valkyrie2889 lets you accurately benchmark the performance of Layer 2 LAN switches according to RFC 2889 tests incl. all throughput and forwarding rate tests, congestion control, address caching capacity, address learning rate, broadcast frame forwarding and latency, forward pressure and maximum forwarding rate.

Stream-oriented Traffic Generation
Users can define and generate hundreds of transmit and receive streams, each with their own unique traffic profile. Each stream can generate 100k’s of unique traffic flows using programmable packet field modifiers to increment or randomize field values such as MAC addresses, IP addresses, and VLAN identifiers. This makes it easy to scale your tests beyond the maximum performance parameters of your network or device.
The stream rate can be defined as a percentage of line rate, frames per second, bit-rate, and the injection of packets can be controlled as a single-packet shot, number of packets, time duration, or in continuous mode.
Traffic profiles can be defined as uniform or bursty, and custom packet editing is facilitated by a graphically driven field editor that lets users build any packet format, in addition to predefined packet templates for Ethernet, Ethernet II, VLAN, ARP, IPv4, IPv6, UDP, TCP, LLC, SNAP, GTP, ICMP, RTP, RTCP, STP, SCTP, MPLS, PBB, FCoE, IGMPv2/3, or fully specified by user.
Statistics Charting and Logging
Scheduling
Each testbed can contain several schedules – a collection of operations that will be executed sequentially, with looping support. Common usage of Stream Scheduler includes start-and-stop traffic, changing packet rate, changing operations orders, adding loop section, etc.
Real-time Analysis and Reporting
Packet flow statistics are tracked per stream, or per-user defined filters which can include any combination of programmable field values. Incoming packet streams are automatically identified using optionally auto inserted Test Payload fields. Analysis of traffic throughput, latency, jitter, loss, sequence, and misorder errors is performed real-time per received stream with 16/32 ns accuracy depending on the interface type (optical/electrical).
Users can capture packets at wire speed on each port for detailed analysis and hot-button export packet analysis tool WireShark, which in conjunction with event triggering and programmable filters provides a unique ability to identify and isolate performance issues.
One Way Latency Measurements
Another valuable Xena feature is Valkyrie TimeSynch which enables multiple Xena testers to synchronize their local time to each other. This can be used for One-Way Latency (OWL) measurements between two test chassis, synchronized traffic start between multiple chassis and accurate time-stamping of captured packets in exported PCAP files.
Scripting & Test Automation
To make scripting and test automation as easy as possible, Xena offers a simple, open-spec text-based Command Line interface (CLI) API called ValkyrieCLI that supports text and line-based TCP/IP communication for test automation in any tool and scripting environment. ValkyrieCLI lets you control very aspect of the chassis, module, port, stream, filter, capture, statistics etc – with any changes being automatically reflected on the GUI.
This uniquely user-friendly “scripting-from-anywhere” concept makes it simple to access the Valkyrietest platform from any proprietary or commercial scripting environment based on languages such as Tcl, Python, Perl, VBA, or Java development environments, using wrappers to convert existing script APIs to the generic Xena API hosted on Github for easy integration.
Unique Eye Diagram
Xena’s latest generation of multi-speed 100GE test modules support a unique feature for analyzing signal quality called the “eye diagram”. Accessed via ValkyrieManager these bit-error-rate (BER) eye diagrams provide a direct visual representation of signal quality after RX equalization.
The eye-diagram is formed by changing the time dimension (sampling delay) and the amplitude dimension (0/1 threshold) of the sampling point of the PHY step-by-step. For each sampling point (x,y), 1 million bits are measured, the number of bit-errors are counted and a simple division gives the BER. The result is the BER eye-diagram (see below).
The color map shows the measured bit-error rate for each point going from 1 million (maximum red) to zero (black). The color scale is logarithmic. Higher resolutions give a clearer diagram and higher values of X and Y will also give a higher precision in the vertical and horizontal bathtub curve estimations, respectively.
The eye-diagram is a unique feature for analyzing signal quality. It provides an estimate of parameters including width, height and jitter in a convenient graphical format.

ValkyrieManager test software – Core Functions
ValkyrieManager test software is used to configure and generate streams of Ethernet traffic between Xena test equipment and devices under test (DUTs)at all speeds up 100Gbps, and analyze the results.
The user-friendly interface makes ValkyrieManager test software an effective tool for performing a wide range of core test scenarios for network equipment manufacturers (NEMs), network service providers, research organizations, enterprise, government and conformance testers.
Below: This screen shows a stream statistics chart where the latencies of two streams are displayed in real time.

Top-Features
- Stateless Layer 2-3 traffic generation and analysis
- Ideal for functional and performance tests in 1/10/40 / 100GbE
- Easy management of ports and traffic streams, designed to meet all practice scenarios
- Pact editor with support for packet definitions at protocol and byte level
- Automatic protocol decoding of incoming packets
- Supports multiple Xena test platforms shared by multiple users located in different locations, down to port level via TCP / IP
- Comes for free with every Xena test platform, along with three years of free software updates
- Includes a growing number of useful test apps like ValkyrieCLI, Valkyrie2544, Valkyrie1564, Valkyrie2889 and Valkyrie3918
- Access via any HTML 5 browser possible (via phantom)
The port and stream configuration grids let test engineers quickly view and work with a numerous ports and streams simultaneously.
The traffic streams can be shaped to match very specific real-world scenarios using a wide range of variables. The packet editor function supports both protocol (IP, VLAN, UDP, etc.) and byte-level packet definitions, and the packet capture function can also automatically decode the packet content at the protocol level.
ValkyrieManager also makes it easy to quickly view and analyze traffic statistics, payload errors, latency and jitter. set up specific filters for incoming traffic, and perform real-time capture of packets.
The ValkyrieManager test software offers many ways to streamline testing.
These range from being able to copy and paste stream definitions across ports quickly customizing the GUI to match the test engineers’ needs by e.g. letting them hide irrelevant controls etc so they can better focus on the task they are currently performing.
Once test-beds and test cases have been configured, they can by saved and shared with other users. ValkyrieManager can be used by multiple users in different locations to manage multiple Xena chassis simultaneously.
Wide range of applications
- Evaluate the stability of switches, routers and edge devices under static or dynamic load conditions for minutes, hours and days
- Identify and troubleshoot functional behavior (including negative testing) of new network functionality in the development lab or before deployment into the operational network
- Evaluate key performance parameters such as per-flow QoS, fail-over time or Access Control Lists (ACL); filtering performance
- Perform comparative analysis of devices or services with deterministic traffic during product development cycles or vendor comparisons
- Can be used with ValkyrieCLI for fast, effective test automation
- Can be supplemented with Veryx ATTEST (purchased separately) for effective conformance testing
Basic Work Flow
ValkyrieManager is always praised for its simple user-friendly approach to testing. The basic work flow goes like this:
- 1. Launch ValkyrieManager test software.
- 2. Connect to one or more Xena chassis via IP address.
- 3. Reserve the ports on the test modules you want to use.
- 4. Configure the ports (e.g. minimum IFG, MAC Address, Mac training, enable flow control, gap monitoring, payload checksum, max. stream header, loopback mode, latency offset, configure IPv4 address for ARP and PING requests).
- 5. Add and configure the traffic streams. This can include a unique stream ID for identifying latency, jitter and packet loss; when to start, stop and register the stream; the burst rate, error injection, frame checksums, types of packet length, and the payload type..
- 6. Define flows of traffic based on e.g. source and destination MAC and VLANs (ValkyrieManager can support over 4 billion flows)..
- 7. Define filters to get statistics on specific types of packets, content or packet sizes, or to trigger the capture mechanism or focus Histogram results..
- 8. Create triggers for when the capture function should start/stop and what should be captured e.g. FCS or payload error frames etc. You can also save the capture buffer as a PCAP file for analysis in e.g. Wireshark..
- 9. Once the traffic is started view the results in the capture graph or use histograms to plot distributions of values over time..
- 10. View detailed summaries of all this data via the Global Statistics or analyze port, packet and service issues in the Event Log lists..
CHIMERA
Network Impairment Emulator
for up to 100Gbps

Why choose Chimera?
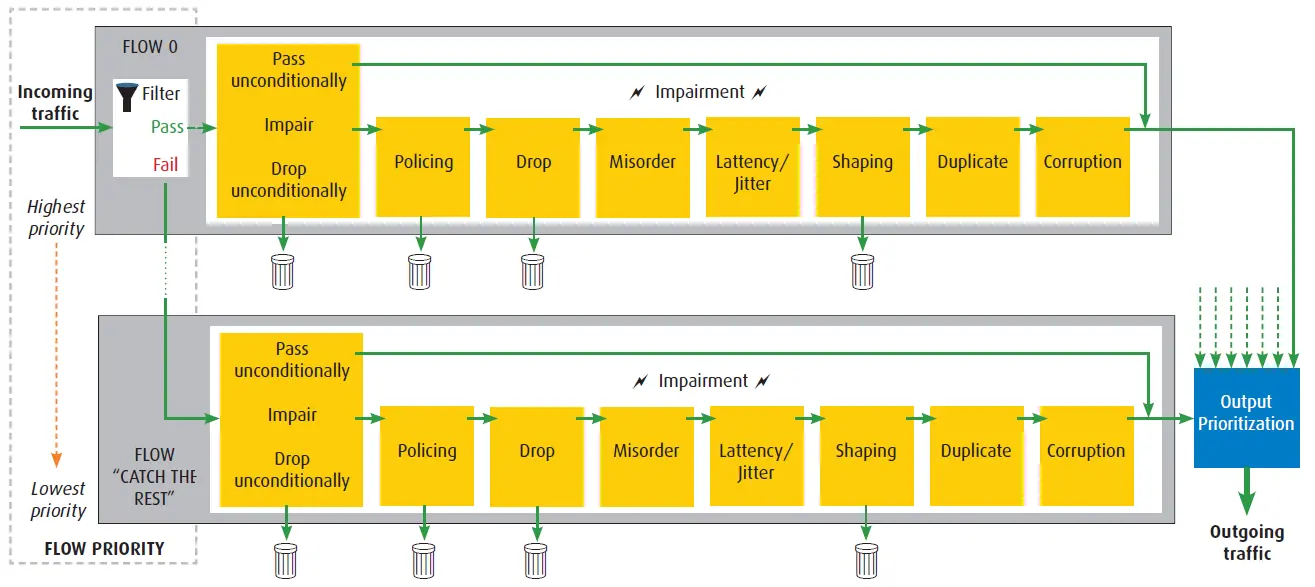
Chimera is a network impairment emulator that makes it easy to introduce consistent, accurate, well-defined and repeatable impairments (e.g. packet manipulation, latency, jitter, bandwidth control and shaping) to traffic between test objects in the lab. All rates from 10GE to 100GE are supported by a single 2-slot test module.
Chimera is ideal for network device manufacturers who want to optimize Quality of Experience (QoE) for their customers by ensuring that their devices can handle acceptable degradations. Service providers, enterprises and government agencies can also use Chimera to validate Quality of Service (QoS) for voice, video and data traffic transmitted over their networks.
Chimera can be used as a stand-alone solution, but can also be built into a ValkyrieBay chassis as a test module to allow seamless integration with the ValkyrieManager traffic generator. This provides a really easy way to mimic traffic degradation generated by Valkyrie using the same GUI.
Finally, Chimera is available at a price/point that is approximately half the industry standard.
Key Applications
Chimera makes it easy to emulate network impairment, making it an extremely cost-effective and convenient solution for:
- Benchmarking
- Stress tests / negative tests
- “What-if tests?
- Regression tests
Chimera System Diagram
Software
Valkyrie Manager
ValkyrieManager is the Windows-based application that allows Ethernet data streams to be configured and generated between Xena’s Valkyrie testers and Devices Under Test (DUTs) at speeds of up to 400 Gbps to analyze results.
When ValkyrieManager detects a Chimera test module in a Valkyrie chassis, Chimera’s software options for adding impairments are available in ValkyrieManager, allowing test engineers to manage the emulation of impairments through the same GUI they use to generate traffic.
Learn more about ValkrieManager

Chimera Manager
ChimeraManager is a web-based interface for configuring and emulating consistent, accurate, well-defined, and repeatable degradations such as latency and jitter in traffic between test items in the lab.
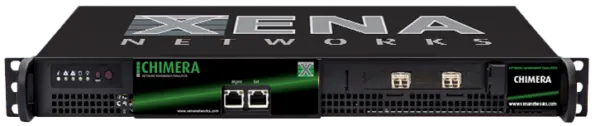
Hardware
Chimera can be used as a stand-alone unit or integrated into a Valkyrie chassis. ChimeraCompact is a 19″ rack-mountable housing that can also be used as a desktop device without any problems. In a ValkyrieBay chassis, a Chimera test module requires 2 of the 12 slots.
Speeds


Videos
Chimera is Xena’s new Ethernet impairment emulator. It’s fully integrated with our Valkyrie Ethernet traffic generator, making it the only hardware-based solution on the market that lets you use the same GUI to both generate and impair wirespeed Ethernet traffic, right up to 100Gbps. This makes it easy to use and highly cost-effective.
Check out the videos and see for yourself.
A step-by-step guide to how Chimera works using Xena’s live demo system.
Chimera 1: Live demo - step by step

How to add basic types of latency and jitter to Ethernet traffic using Chimera.
Chimera 2: Latency and Jitter

How to control bandwidth using Chimera’s policers and shapers.
Chimera 3: Bandwidth Control

How to use Chimera flow filters to map incoming packets to up to 8 different flows per port & then independently impair each flow.
Chimera 4: Flow Filters
