Category Archives: Network Blog

Firewall Performance Testing with Xena VulcanBay

In this concrete test case we used a Xena VulcanBay with 2x 40 Gbps QSFP+ interfaces to test some next-generation firewalls regarding their performance. Specifically, we were interested in the following test scenarios:

  • Pure throughput
  • High number of connections (session load)
  • Use of NAT
  • Realistic traffic
  • Longer testing periods during which we “pushed” new firewall rules to detect potential throughput breaches

In this article we want to show how we used the Xena VulcanBay including its management, the VulcanManager, and a Cisco Nexus Switch to connect the firewall clusters. We list our test scenarios and give some hints about potential stumbling blocks.

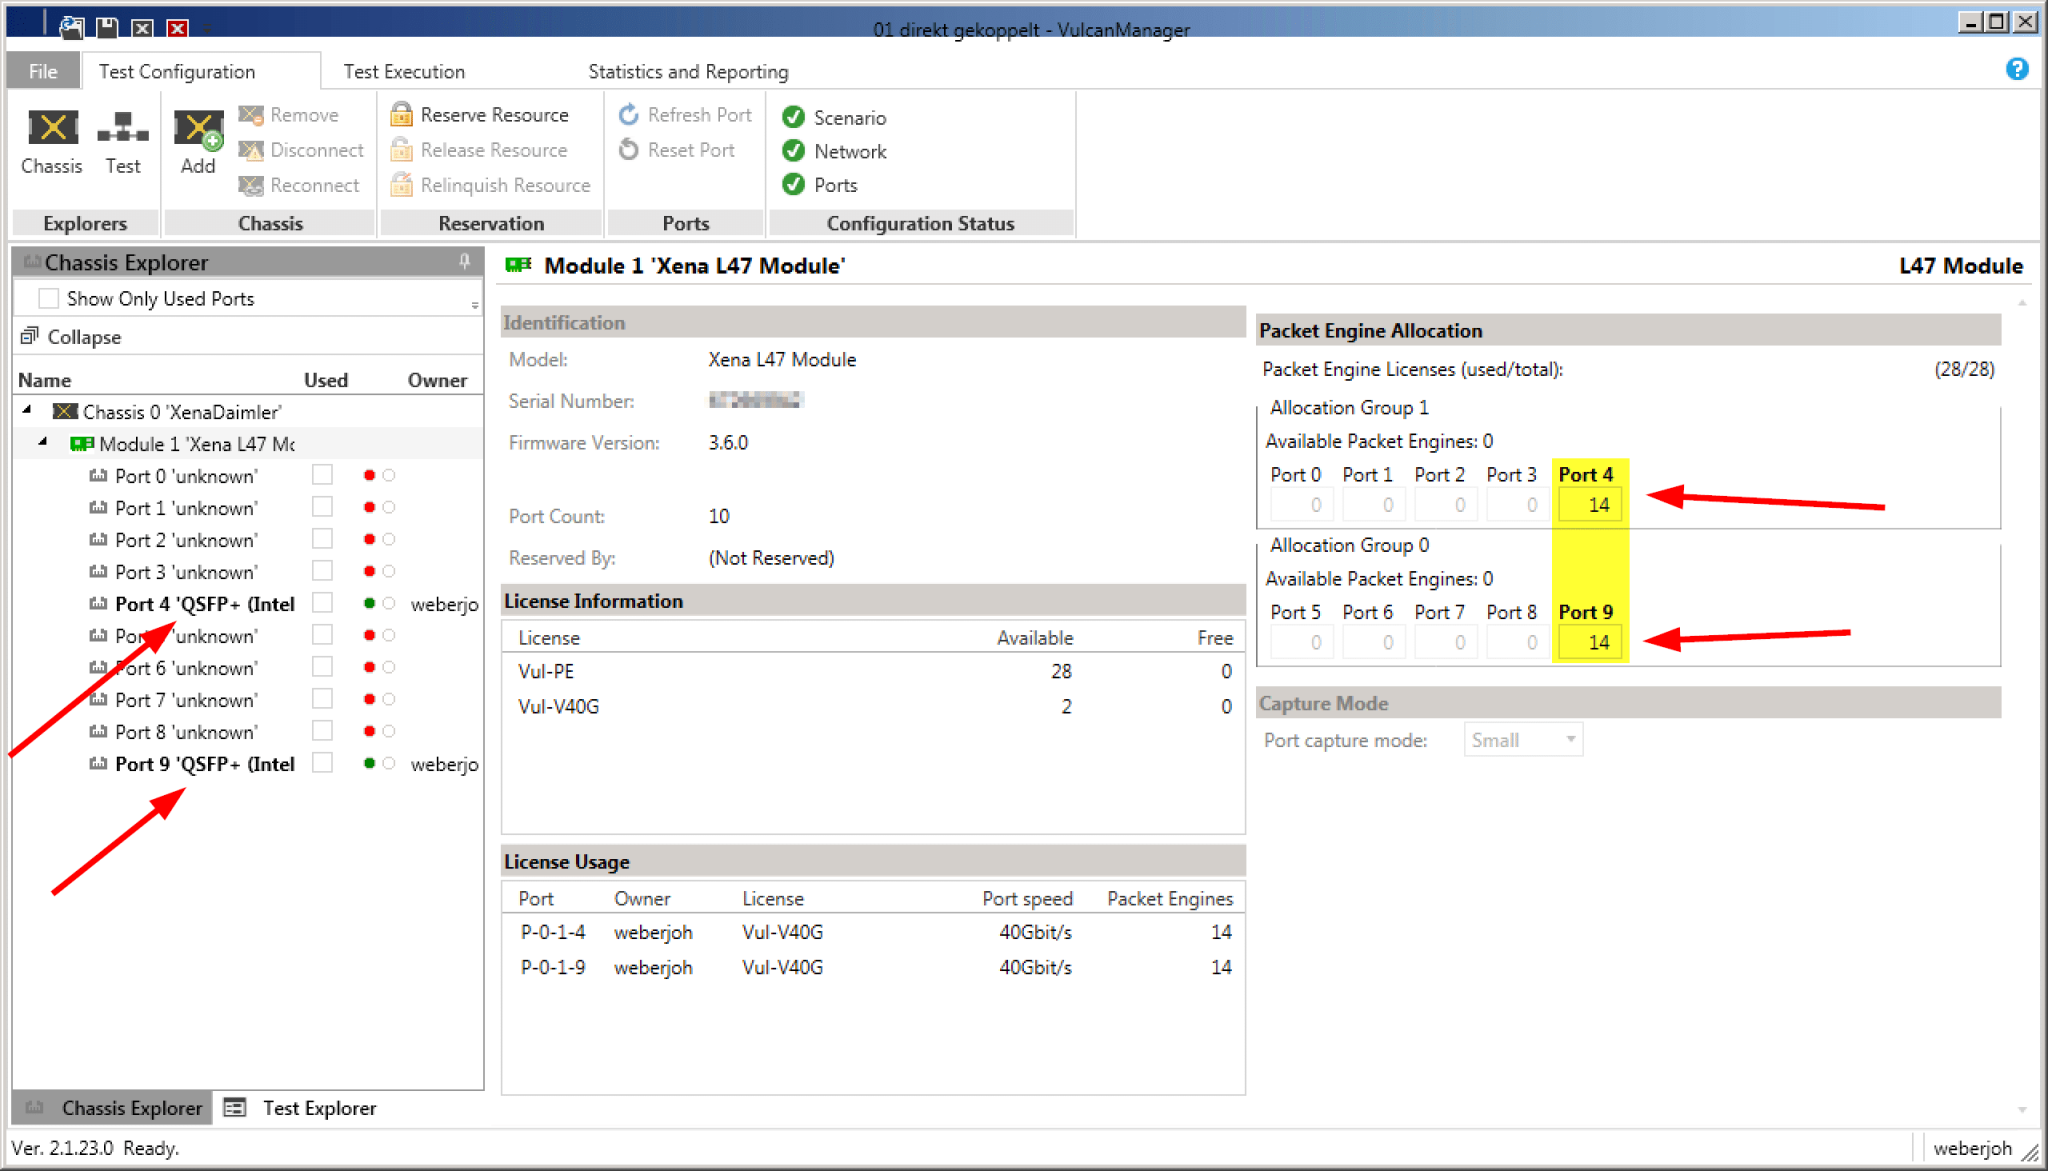
For our tests we had a Xena VulcanBay Vul-28PE-40G with firmware version 3.6.0, licenses for both 40 G interfaces and the full 28 Packet Engines available. The VulcanManager ran on version 2.1.23.0. Since we only used one single VulcanBay (and not several at distributed locations), the only admin user was able to distribute the full 28 Packet Engines equally on these two ports.

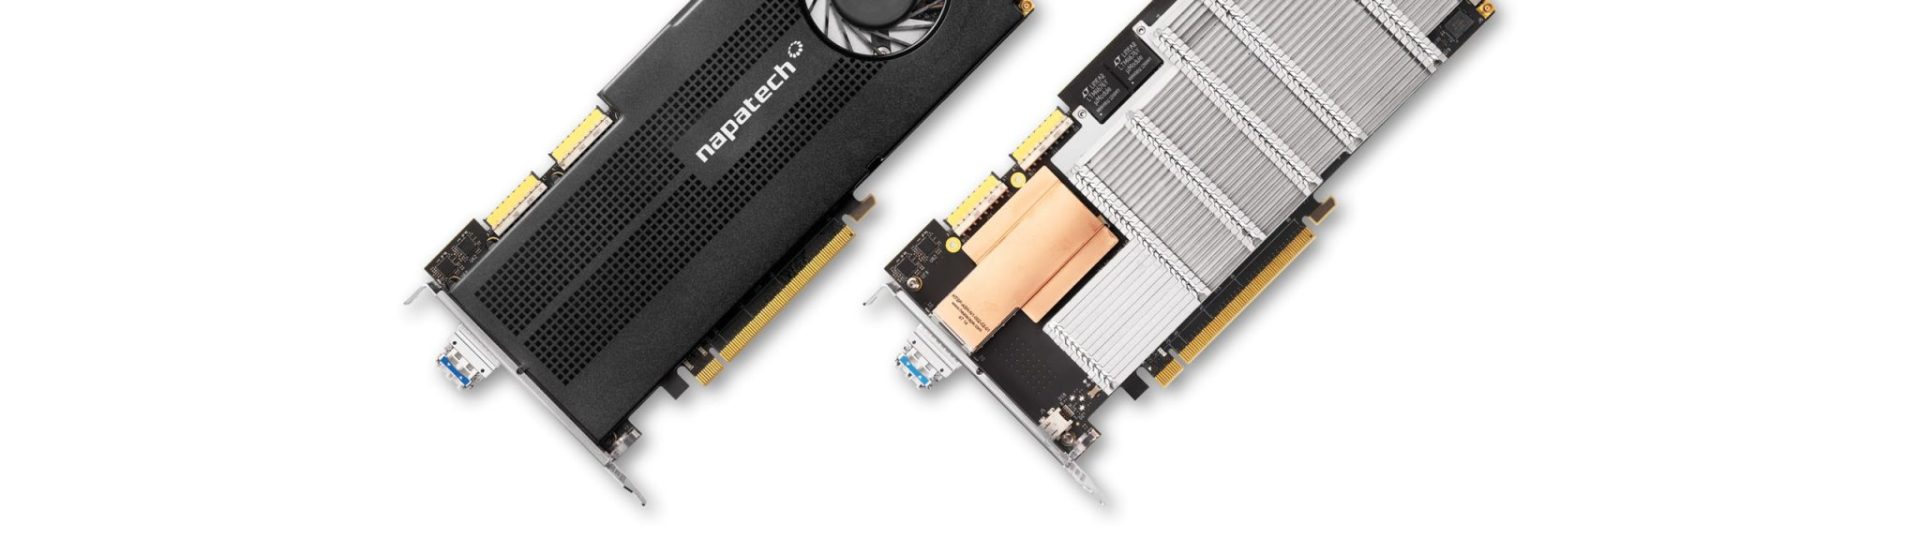
For tests with up to 80 G throughput two QSFP+ modules (left) as well as the distribution of the packet engines on these ports (right) were sufficient.

Wiring

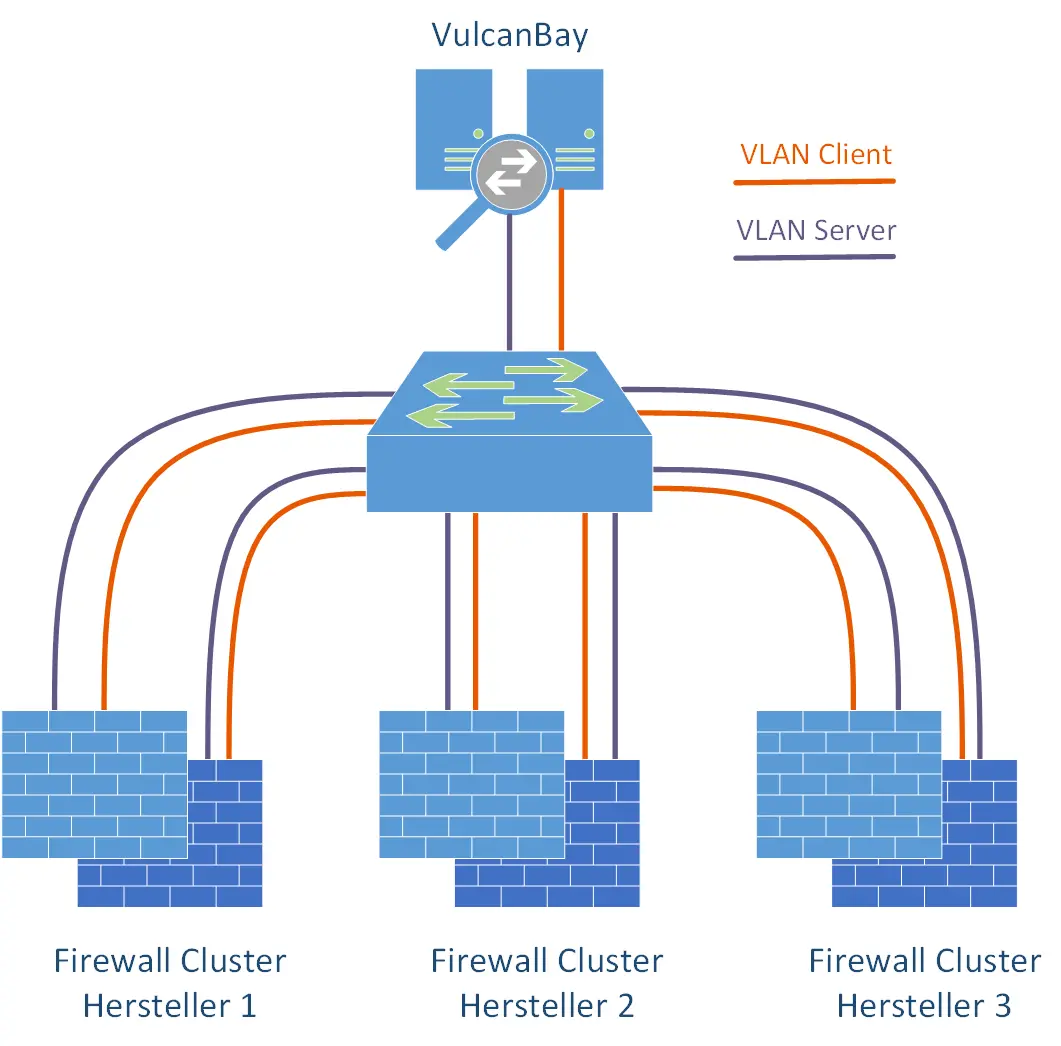
We used a single Cisco Nexus switch with sufficient QSFP+ modules and corresponding throughput to connect the VulcanBay to the respective firewall clusters. Since we had connected all firewall clusters as well as VulcanBay to this switch at the same time, and had always used the same IPv4/IPv6 address ranges for the tests, we were able to decide which firewall manufacturer we wanted to test purely with the “shutdown / no shutdown” of individual interfaces. Thus the complete laboratory was controllable from a distance. Very practical for the typical case of a home office employee. Furthermore, it was so easy to connect VulcanBay “to itself” in order to get meaningful reference values for all tests. For this purpose, both 40 G interfaces to VulcanBay were temporarily configured in the same VLAN.

With two lines each for client and server, all firewall clusters were connected to a central switch. Also the VulcanBay from Neox Networks.

There are switches with QSFP+ modules, which are however designed as 4x 10 G and *not* as 1x 40 G. For the connection of the VulcanBay with its 40 G interfaces, the latter is unavoidable.

Thanks to modern QSFP+ slots with 40 G interfaces, a duplex throughput of 80 Gbit/s can be achieved with just two connections.

IP Subnets

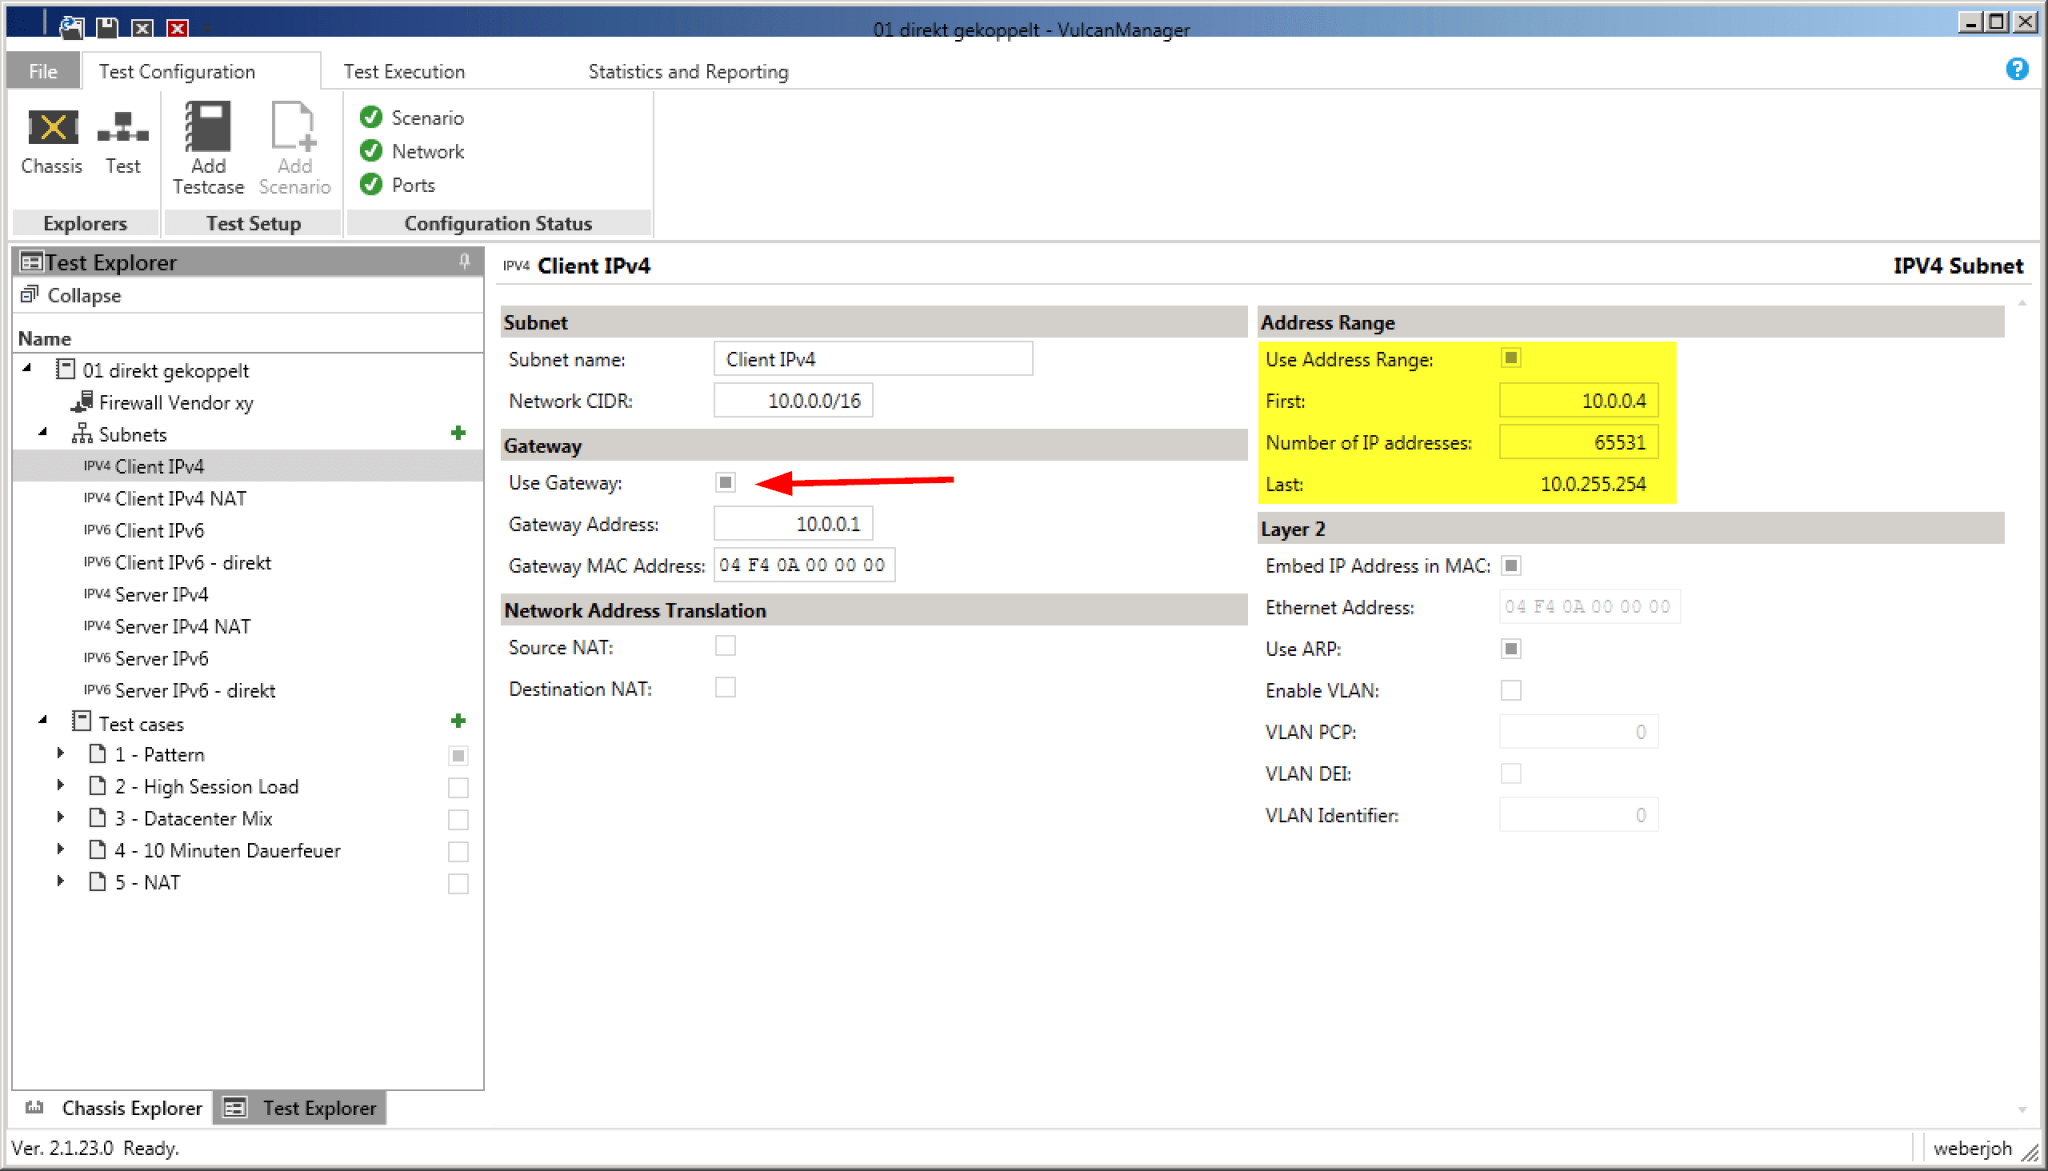
In our case we wanted to test different firewalls in Layer 3 mode. In order to integrate this “Device Under Test” (DUT) routing we created appropriate subnets – for the outdated IPv4 protocol as well as for IPv6. The IP subnets simulated by VulcanBay are then directly attached to the firewall. In the case of a /16 IPv4 network, exactly this /16 network must also be configured at the firewall. Especially important is the default gateway, for example 10.0.0..1 for the client IPv4 network. If you additionally use the option “Use ARP” (right side), you do not have to worry about the displayed MAC addresses. The VulcanBay resolves these itself.

The address range must be adjusted so that the tests performed are not equivalent to MAC flooding.

The same applies to IPv6. Here the network is not entered in the usual slash notation, but simply the gateway and the address range are determined. Via “Use NDP” the VulcanBay automatically resolves the Layer 2 MAC address to the Layer 3 IPv6 address.

The “Use Gateway” tells VulcanBay that an intermediate router/firewall should be used for the tests.

MAC Flooding! Depending on the test scenarios used, VulcanBay may simulate millions of IPv4/IPv6 addresses in the client or server segment. This is a pure flood of MAC addresses for every intermediate switch or firewall. Common high-end weights can hold a maximum of 128 k MAC addresses in their MAC address table. If you leave the default range of 16 million (!) IPv4 addresses, or 1.8 x 10^19 IPv6 addresses set by Xena Networks by default, any test results are meaningless. Therefore we strictly recommend to reduce the address ranges from the beginning to realistic values, as you can see in the screenshot above (yellow marked: 65 k addresses).

For reference values, the VulcanBay was also “connected to itself” for all tests. While IPv4 allowed using the same “subnets” networks with different address ranges, IPv6 required subnets within the *same* /64 prefix.

Testcases

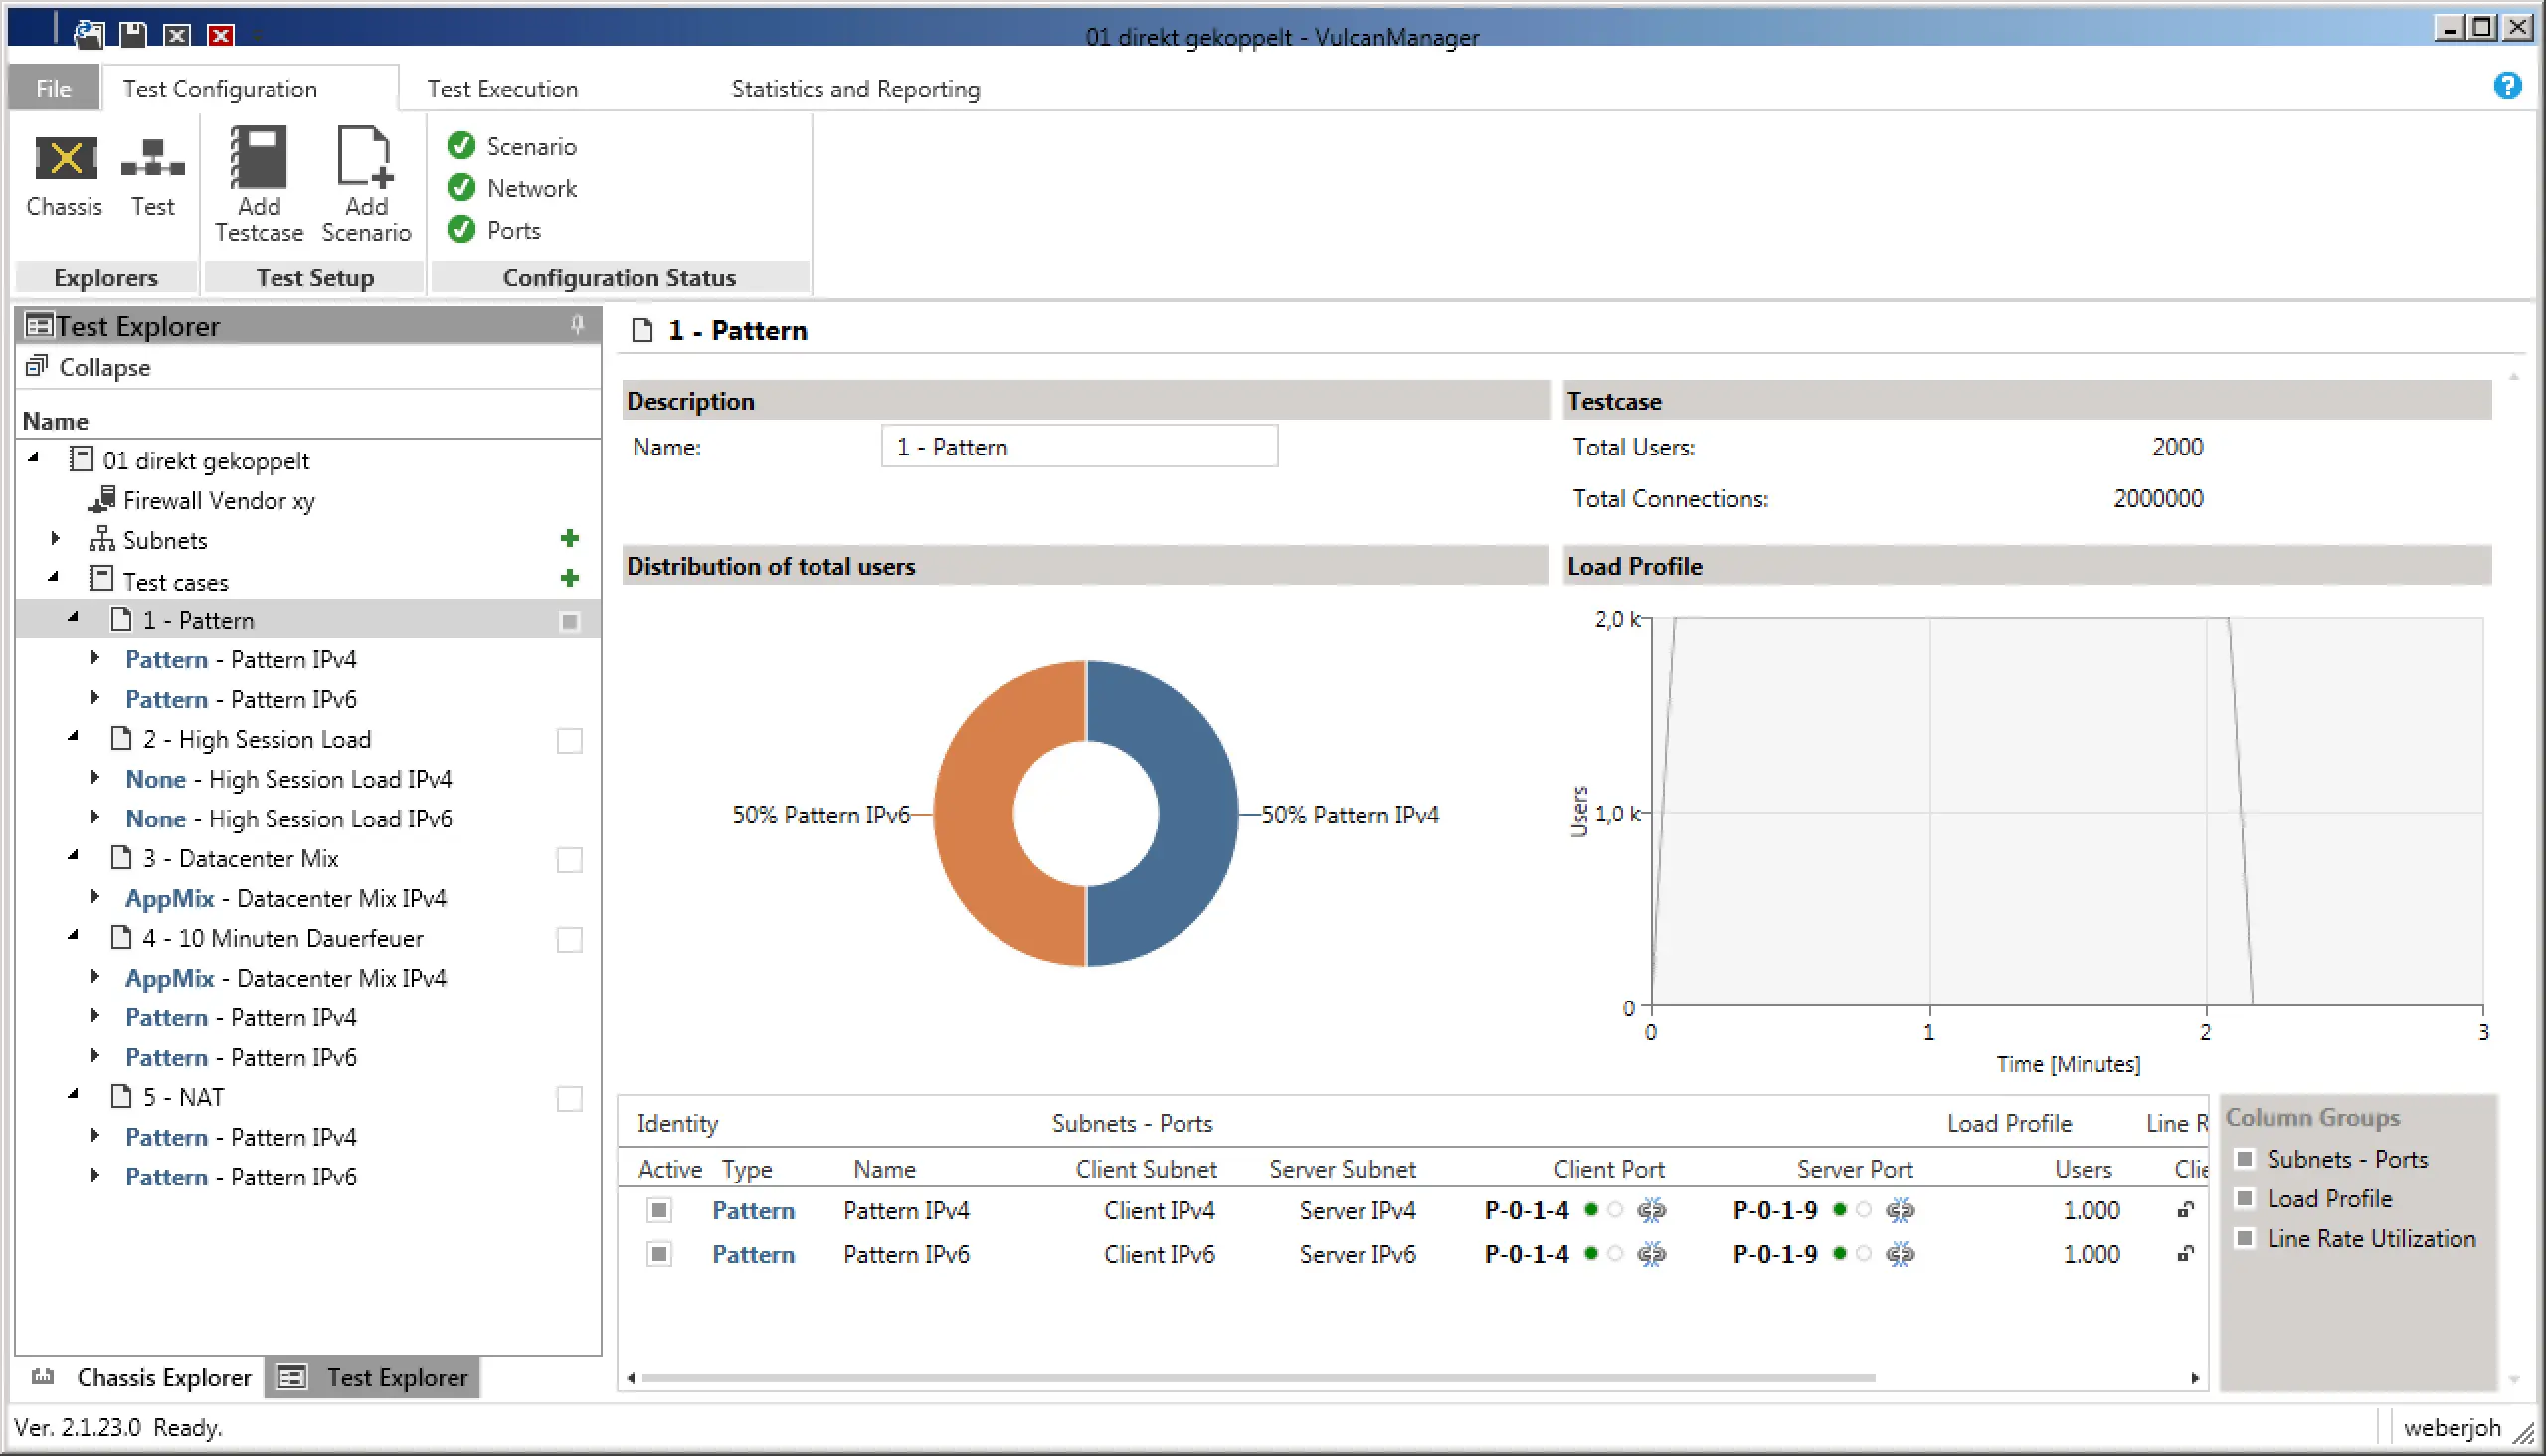
1) Pure throughput: In the first test scenario, we were purely concerned with the throughput of the firewalls. For this we chose the “Pattern” scenario, once for IPv4 and once for IPv6, which automatically sets the ratio to 50-50. In the settings we have additionally selected “Bidirectional” to push through data in both directions, i.e. duplex, in both cases. So we could reach the maximum throughput of 80 G with the 2x 40 G interfaces. In order to distribute the bandwidth over several sessions (which in real life is the more realistic test case), we selected 1000 users, who should establish connections from 100 source ports to 10 servers each. Makes 1 million sessions each for IPv4 and IPv6. With a ramp-up time of 5 seconds, i.e. a smooth increase of the connections instead of the immediate full load, the pure test ran through 120 seconds afterwards, before it also had a ramp-down time of 5 seconds.

Test scenario “Pattern” with a 50-50 distribution of IPv4 and IPv6. The “Load Profile” (right) shows the users to be simulated using the time axis.

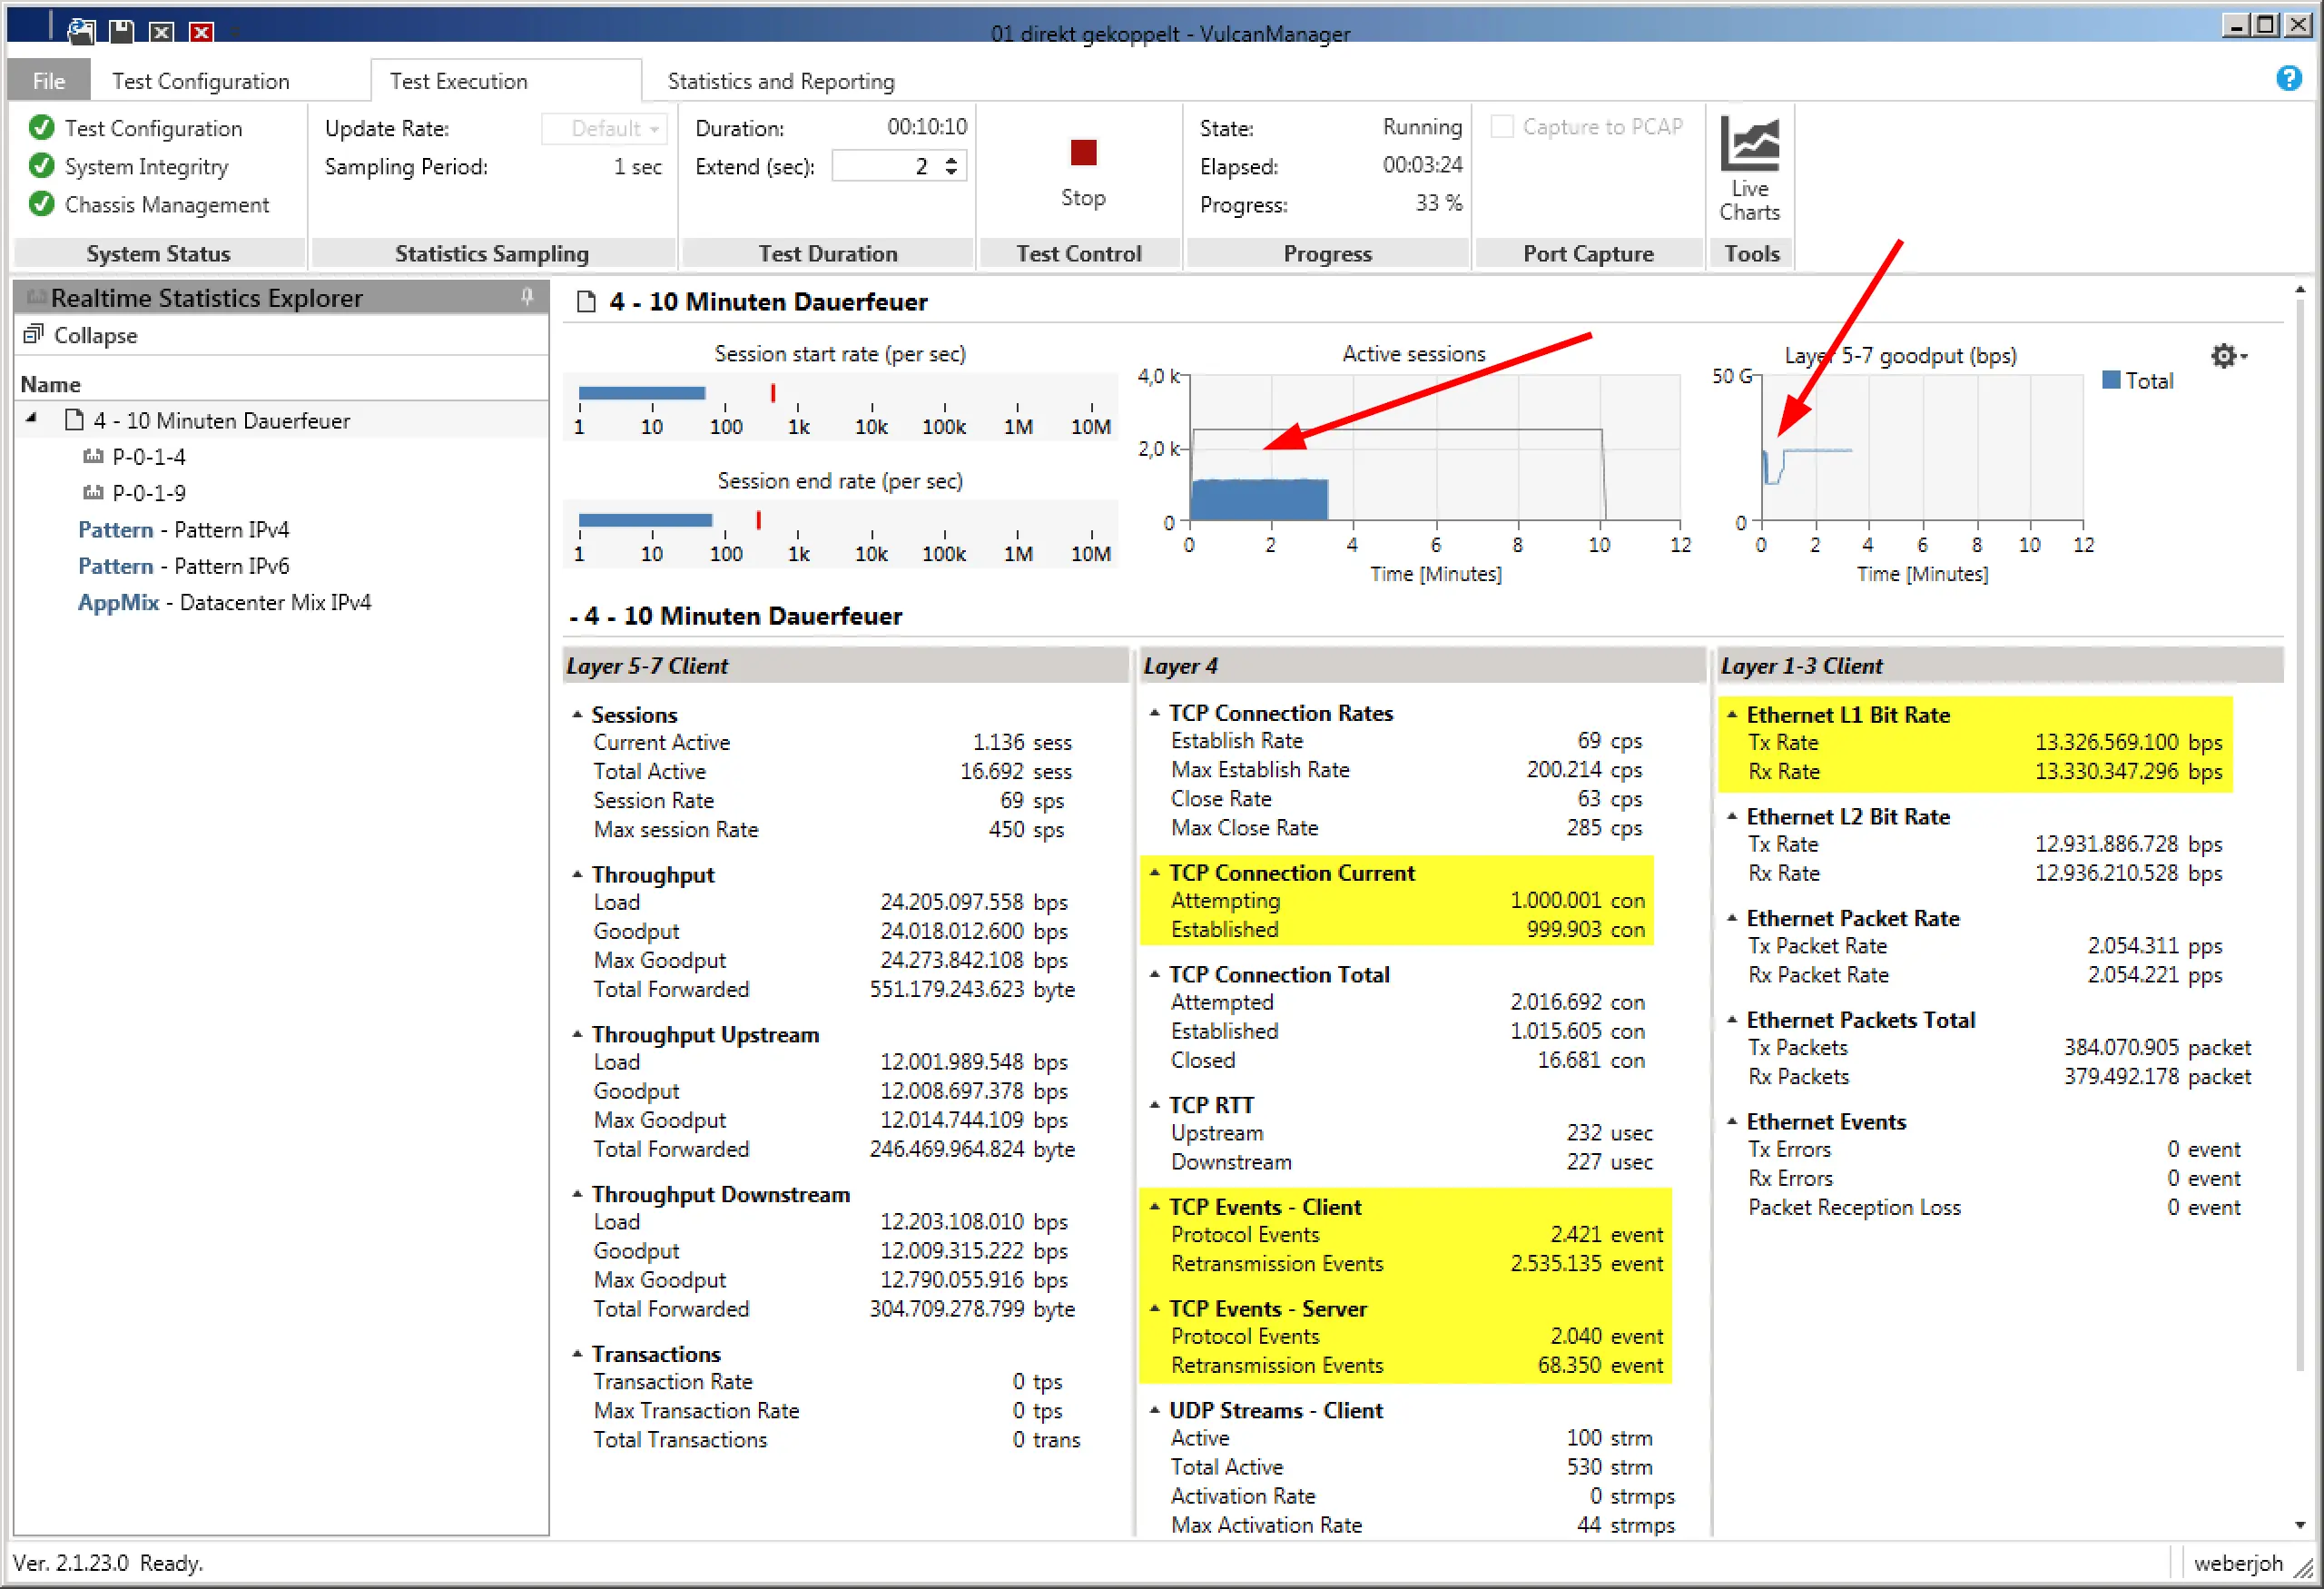
During the test, the VulcanManager already displays some useful data, such as TCP Connections or Layer 1 throughput. By means of the graphics in the upper area, one gets a good impression at a glance. In the following screenshot you can see that the number of active connections is less than half of the planned one (bad), while Layer 5-7 Goodput has an unattractive kink at the beginning of the test. Both problems turned out to be errors in the IPv6 implementation of the tested device.

While theoretically 2 million sessions at 80 G throughput should have passed the firewall, less than half of them got through cleanly.

The graphic “Active Sessions” does not show the actual active sessions, but the number of simulated users in the Live View during the test as well as in the later PDF report. While the graph is correct for the 2000 users, there were actually 2 million sessions during the test.

2) High number of connections (session load): Also for IPv4 and IPv6, 20 million parallel TCP sessions were established and maintained during this test. Not only the sum of the sessions was relevant, but also the short ramp-up time of only 30 seconds, which corresponded to a setup rate of 667,000 connections per second! The sessions were left standing for 60 seconds, but without transferring any data. Over a further 30 seconds they were terminated again, typical for TCP via FIN-ACK. The aim was that the firewalls to be tested would firstly allow the connections to pass through cleanly and secondly they could also dismantle them cleanly (and thus free up their memory).

Before each test we deleted the MAC address table on the switch as well as the session, ARP and NDP caches on the firewalls. So every test was done from zero to zero.

3) NAT scenarios: The same test as under 1) was used, with the only difference that the IPv4 connections from the client network to the server network were provided with a source NAT on the firewalls. The goal was to find out if this would cause a performance degradation of the firewalls.

4) Realistic Traffic: With a predefined “Datacenter Mix” we were able to simulate the flow of two HTTPS, SMB2, LDAP and AFS (via UDP and TCP) connections for several thousand users with just a few clicks. This was not about a full load test of the firewalls, but about the set-up and dismantling speeds as well as the application detections. Depending on whether the app IDs of the firewalls were activated or deactivated, there were major differences here.

5) 10 minutes of continuous fire with commits: This somewhat more specific test consisted of scenarios 1 and 4, i.e. full load (1) with constant session setup and shutdown (4) at the same time. This ran constantly for 10 minutes, while we installed another 500 rules on each firewall. Here we wanted to find out if this process creates a measurable kink in throughput on the firewalls, which was partly the case.

Test results

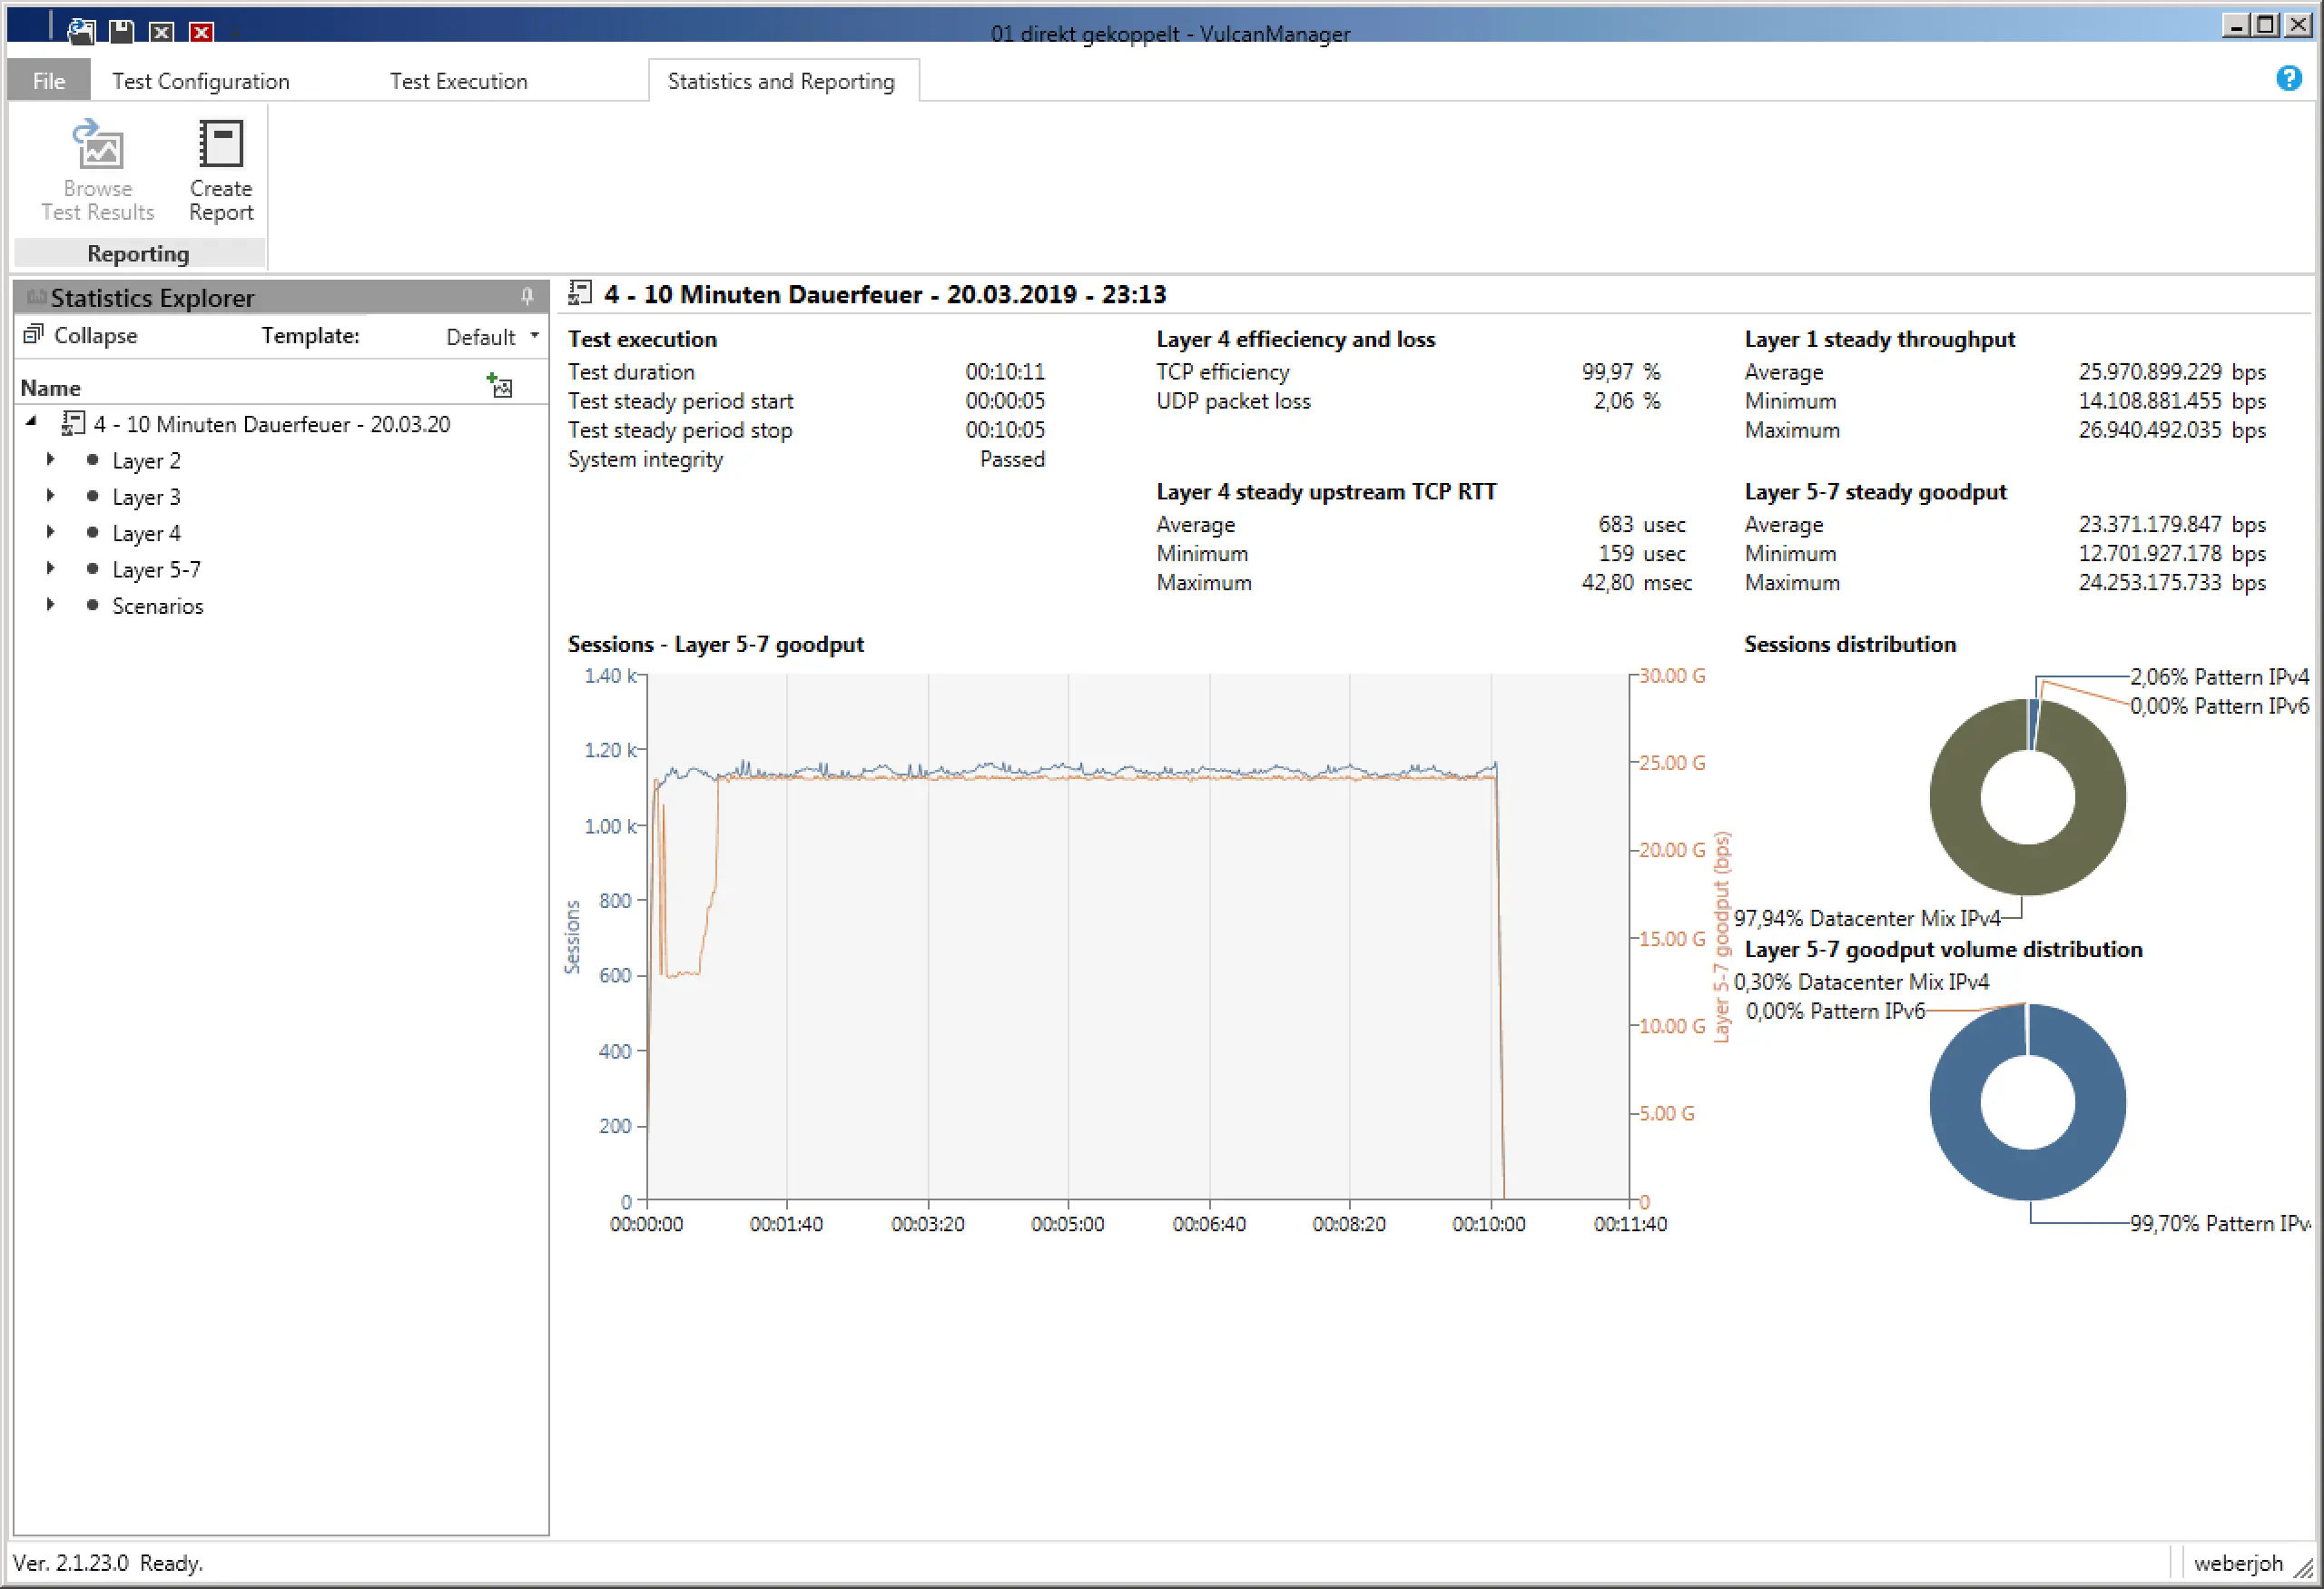
At the end of each test, VulcanManager displays the Statistics and Reporting page with all possible details. By “Create Report” you can create a PDF, which contains besides all details also information about the selected test scenario as well as information about the tested device. The challenge is to distinguish the relevant numbers from the less relevant ones and place them in the right context to get meaningful results. During our comparisons of different Next-Generation Firewalls we restricted ourselves to the “Layer 1 steady throughput (bps)” for the throughput test, or the “Successful TCP Connections” for the connection test. Compared to the reference values at which the VulcanBay was connected to itself, this already yielded meaningful comparable results that could be easily displayed both in table form and graphically.

The Statistics and Reporting page provides a rough overview (middle) and the possibility to read test values from all OSI layers and the selected test scenarios (links, fold-out tabs).

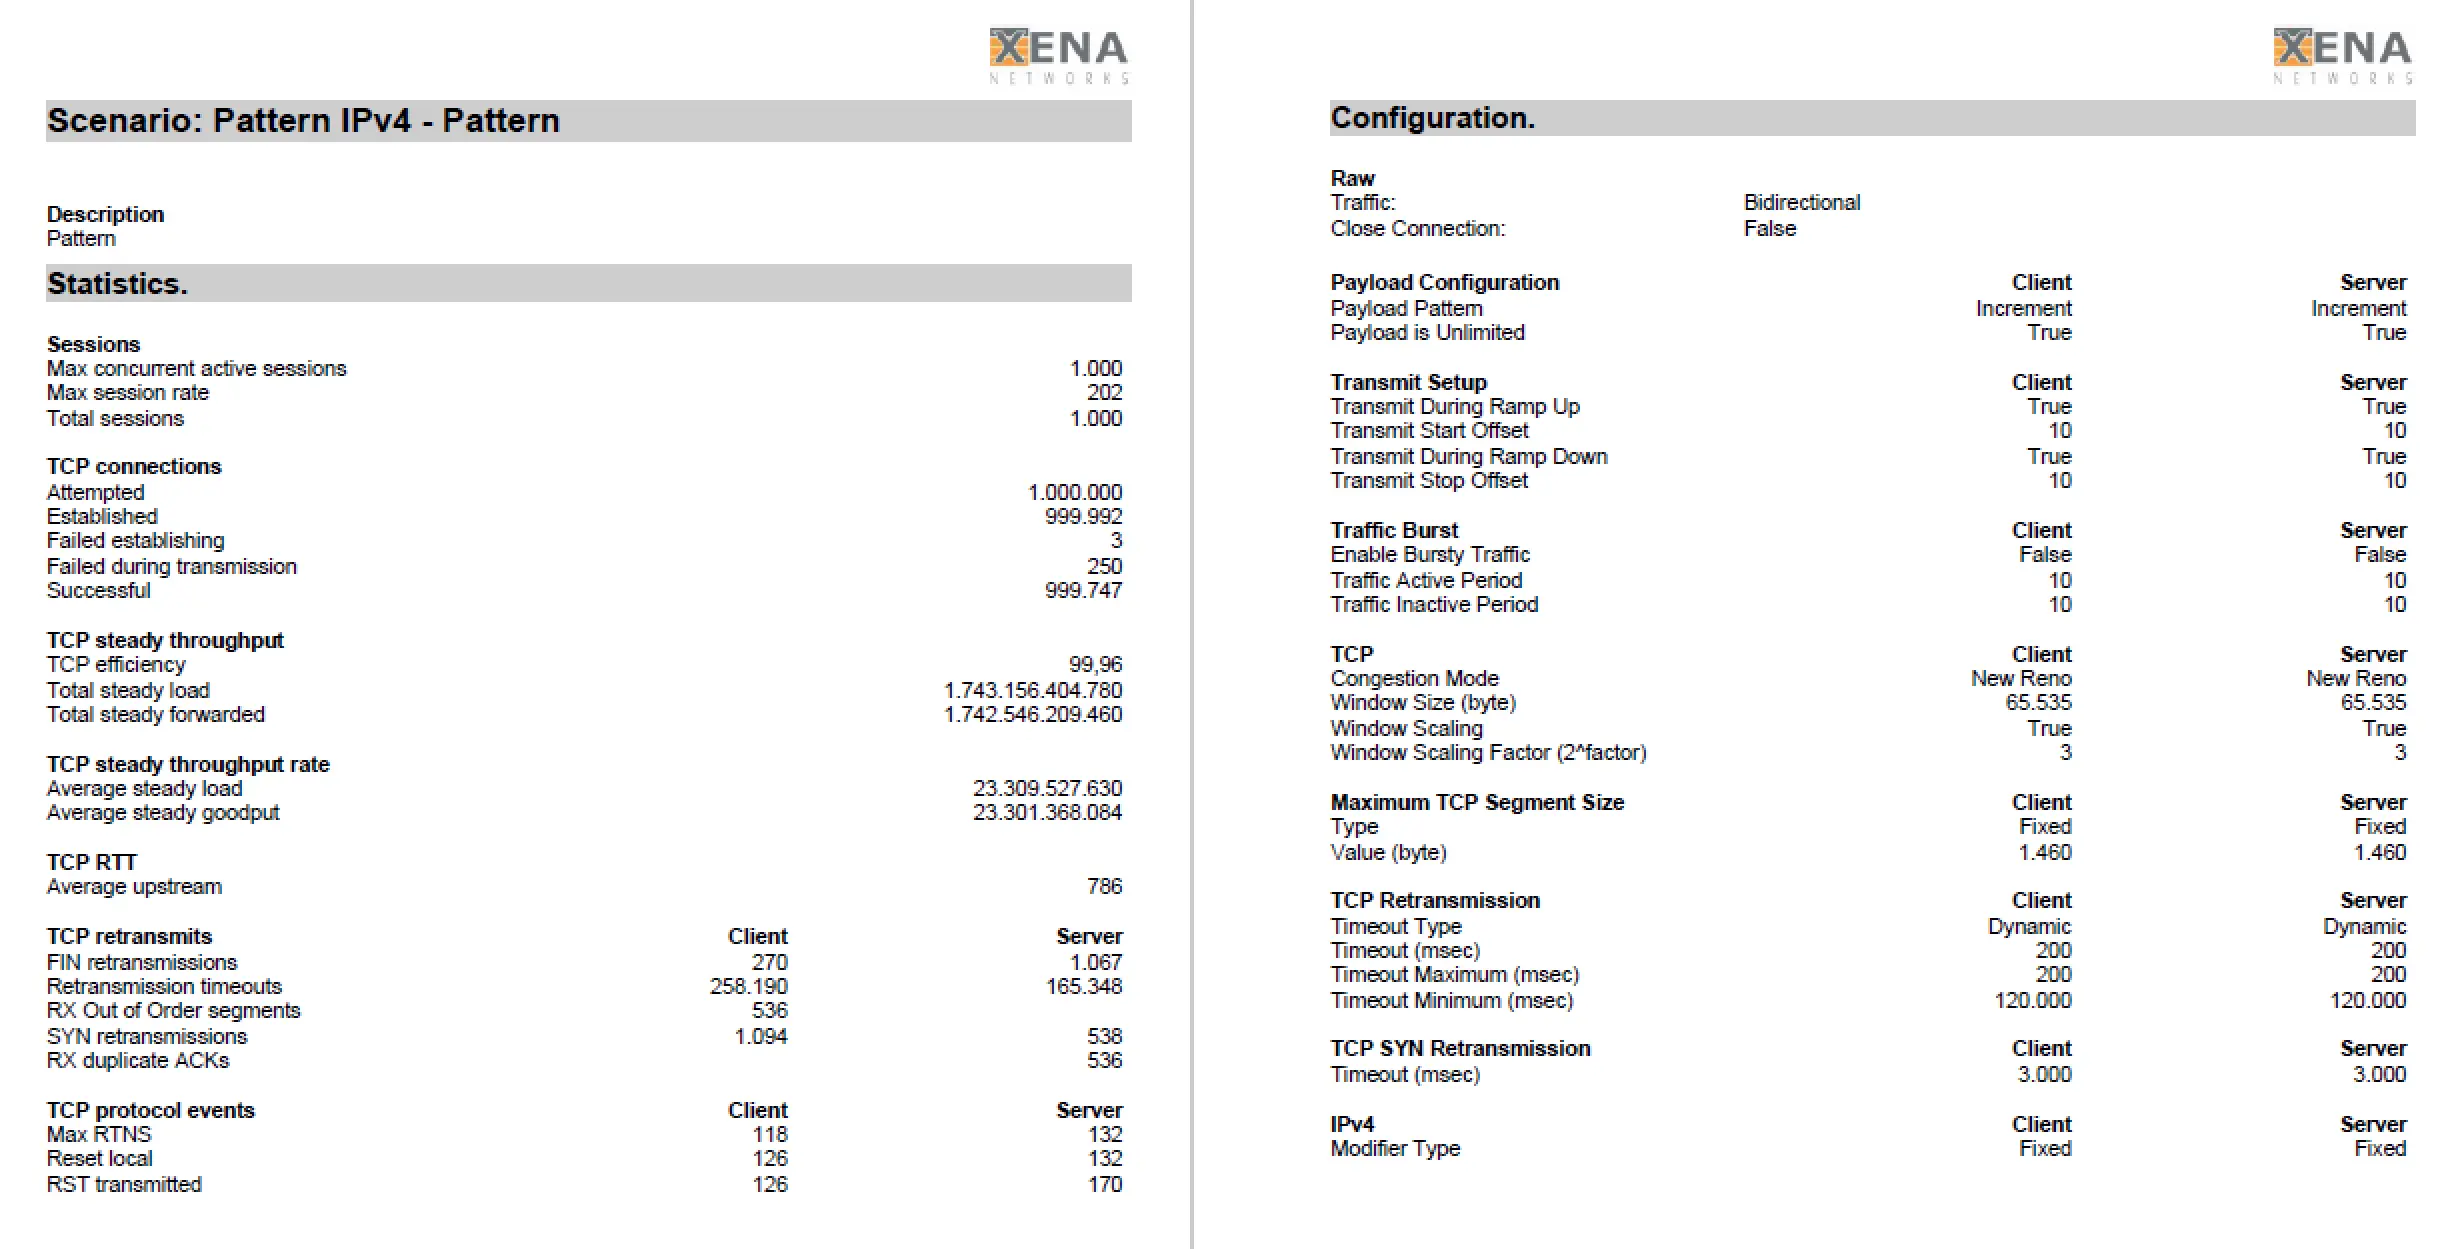
Detail of a PDF report with all details.

The various existing “Application Mix” scenarios of Xena Networks do not serve the direct comparison of firewall performance values, but the targeted generation of network traffic. This way, application detections can be checked or other scenarios executed in parallel can be “stressed” a little more.

Further Features

Note that VulcanManager has some other interesting features that we did not use in this case study, such as TLS Traffic (for testing TLS interception) and Packet Replay (for testing custom and more specific scenarios extracted from uploaded PCAPs). Also we have not used many application or protocol oriented test scenarios like Dropbox, eBay, LinkedIn or HTTPS, IMAP, NFS. This is due to our testing purposes, which were strongly focused on pure throughput and number of sessions.

Conclusion

The VulcanBay from XENA Networks is the ideal test device for comparing various next-generation firewalls. Within a very short time we had configured and tested various test scenarios. Only the abundance of test results was initially overwhelming. The trick was to concentrate on the relevant information.

Up to 14x Wireshark Performance Increase – Napatech Link™ Capture Software for Napatech SmartNIC

Solution Description


Wireshark is a widely-used network protocol analyzer allowing users to see what is happening on their networks at a microscopic level. It is the de facto standard across many commercial and non-profit enterprises, government agencies, and educational institutions for troubleshooting and protocol analysis.

Wireshark has a rich feature set including deep inspection of hundreds of protocols, live capture and offline analysis. However, as capable as Wireshark is at inspecting and analyzing network protocols, it will only be as effective as its implementation.

The ability to capture and analyze traffic at lossless rates is of the utmost importance for Wireshark to be successful. To decode all traffic, it is a fundamental requirement that Wireshark “sees everything”. If any traffic is missed, full protocol analysis is not possible. And if the capture server is overburdened and too slow to handle the incoming packet rate, packets are discarded, and information lost forever.

But examining the contents of every network packet is extremely CPU-intensive, especially for a multi-gigabit traffic load. And this is the limiting factor in Wireshark performance: the packet processing on the CPU.

In addressing this challenge, Napatech has created a hardware acceleration solution, based on the Napatech Link™ Capture Software, that alleviates the load on the CPU and thereby greatly increases Wireshark capture perfor- mance.

Key Solution Features


  • Lossless capture and protocol decode for up to 13 Gbps on a single thread for traffic analysis, inspection and detection
  • Onboard packet buffering during micro-burst or PCI Express bus congestion scenarios
  • Advanced host memory buffer management enabling ultra-high CPU cache performance
  • Packet classification, match/action filtering and zero-copy forwarding
  • Intelligent and flexible load distribution to as many as 64 queues improving CPU cache performance by always delivering the same flows to the same cores

The Napatech difference


The Napatech Link™ Capture Software dramatically increases capture and protocol analysis, allowing network engineers to utilize the full power of Wireshark to understand network traffic, find anomalies, and diagnose network issues at incredible speeds. The solution offloads processing and analysis of networking traffic from the application software, while ensuring optimal use of the standard server’s resources leading to effective Wireshark acceleration.

Outstanding lossless performance


Optimized to capture all network traffic at full line rate, with almost no CPU load on the host server, the solution demonstrates enormous lossless performance advantages for Wireshark: up to 14x lossless capture and decode performance compared to a standard network interface card (NIC).

Turning acceleration into value

These performance advantages ultimately allow you to:

  • Maximize your server performance by improving CPU utilization
  • Minimize your TCO by reducing number of servers, thus optimizing rack space, power, cooling and operational expenses
  • Diminish your time-to-resolution, thereby enabling greatly increased efficiency

Test configuration


The outstanding improvements achieved with this solution were demonstrated by comparing Wireshark performance running on a Dell PowerEdge R740 with a standard 40G NIC card and the Napatech NT200 SmartNIC with Link™ Capture Software. Test configuration: dual-socket Dell R740 with Intel® Xeon® Gold 6138 2.0 GHz, 128GB RAM running Ubuntu 14.04 LTS.

Lossless throughput tests


For the lossless throughput test, traffic was sent at fixed rates and packet sizes and throughput was measured as the rate at which Wireshark is able to receive and analyze the packets.

Additional testing for “back-to-back frames” was applied as described in the RFC 2544 benchmarking methodology to send a burst of frames with minimum inter-frame gaps to the Device Under Test (DUT) and count the number of frames received/forwarded by the DUT. The back-to-back value is defined as the number of frames in the longest burst that the DUT can handle without the loss of any frames. With same- size capture buffer configurations, the Napatech SmartNIC delivers 60 times higher back-to-back frame performance. When required for highly bursty traffic patterns, the Napatech solution can allocate significantly larger host buffers, providing hundreds of times higher back-to-back capture performance.

Napatech Link™ Capture Software


The stunning benchmarks for Wireshark were achieved by deploying Napatech’s Reconfigurable Computing Platform, based on FPGA-based Link™ Capture Software and Napatech SmartNIC hardware.

Napatech’s Reconfigurable Computing Platform flexibly offloads, accelerates and secures open, standard, high-volume and low-cost server platforms allowing them to meet the performance requirements for networking, communications and cybersecurity applications.

Wireshark


Wireshark, one of the industry’s foremost network protocol analyzers, is an ideal example of the type of critical enterprise applications that can achieve better performance through hardware acceleration with the Napatech LinkTM Capture Software.

Wireshark can be compiled with native support for hardware acceleration based on the Intel hardware and Napatech software. Instructions specific to building Wireshark with support for Napatech are listed in the Installation Quick Guide available at the Napatech Documentation Portal.

Ethernet packets don’t lie – well, at least in most cases

They tell the truth unless they are recorded incorrectly. In these cases, packets can indeed tell bold-faced lies.

When searching trace files, we may come across symptoms in the packets that would make many a person frown in surprise. These are events that seem strange on the surface and can even distract our troubleshooting for a time. Some of these issues have actually misled network analysts for hours, if not days, causing them to chase issues and events that simply do not exist on the network.

Most of these examples can be easily avoided by capturing packets from a network Test Access Point (TAP) rather than on the machine where the traffic is generated. With a network TAP, you can capture the network data transparently and unaltered, and see what is really being transmitted over the wire.

Very large packets

In most cases, packets should not be larger than the Ethernet maximum of 1518 bytes, or what is specified for the link MTU. However, this is only true if we are not using 802. 1Q tags or are in a jumbo frame environment.

How is it possible to have packets larger than the Ethernet maximum? Simply put, we capture them before they are segmented by the NIC. Many TCP/IP stacks today use TCP Segmentation Offload, which delegates the burden of segmenting packets to the NIC. The WinPcap or Libpcap driver captures the packets before this process takes place, so some of the packets may appear far too large to be legitimate.

If the same activity was captured on the network, these large frames would be segmented into several smaller ones for transport.

Zero Delta Zeiten

Zero delta times means that there is no measured time between the packets. When these parcels enter the capture device, they receive a time stamp and a measurable delta time. The entry timestamp on the capture device could not keep up with the volume of packets. On the other hand, if these packets were captured with an external tap server, we could probably get an error-free timestamp.

Previous packets not captured

This warning is displayed because Wireshark has noticed a gap in the TCP data stream. It can determine from the sequenced numbers that a packet is missing. Sometimes this is justified due to upstream packet loss. However, it may also be a symptom that the analyser or SPAN has dropped the packet because it could not keep up with the load.

After this warning, you should look for a series of duplicate ACK packets instead of a defective packet. This indicates that a packet has actually been lost and needs to be retransmitted. If you do not see retransmission or defective packets, the analyzer or SPAN probably could not keep up with the data stream. The packet was actually on the network, but we didn’t see it.

TCP ACKed unnoticed segments

In this case, an acknowledgement is displayed for a data packet that was not detected. The data packet may have taken a different path, or the capturing device may simply not have noticed it.

Recently I have seen these events on trace files captured by switches, routers and firewalls. Since capturing traffic is a lower priority than forwarding (thank goodness!), the device may simply miss some of the frames in the data stream. Having seen the acknowledgement, we know that the packet has made it to its destination.

For the most part, packets tell the truth. They can lead us to the root cause of our network and application problems. Because they present such clear and detailed data, it is very important that we record them as close to the network as possible. This means that we need to capture them during transmission, rather than on the server itself. This helps us not to waste time with false negatives.

If you want to learn more about network visualisation considerations for professionals, download our free infographic, TAP vs SPAN.

How to analyse microbursts with Liveaction Omnipeek

A microburst is a local and sudden downburst (downdraft) within a thunderstorm, usually with a diameter of 4 km, although this is usually much smaller. Microbursts can cause significant damage to the surface and in some cases can even be life-threatening.

In computer networks, a microburst is defined as a brief rush of data that typically lasts only milliseconds, but which overloads the link (Ethernet, Gigabit, 10 Gigabit, etc.). A microburst is a serious concern for any network because even a short term network overload means that some users will not be able to access the network. Because the industry standard for measuring network usage is displayed in bits per second (bps), microbursts often go undetected because they are compensated for during the measurement process. In most cases, traditional network monitoring systems do not report such congestion because it is not present for more than a full second.

The end-user’s experience can be significantly limited if there is too much network traffic or performance bottlenecks caused by a slow data flow or connection failure.

Identifying a microburst requires accurate measurement of network traffic on a link with a microsecond granularity and visualisation in milliseconds. Here is a practical example of how to identify a microburst.

In this example, the measurement point is on a TAP inserted into a 10 Gbit/s link on a data centre link. We measured 45 seconds of network traffic using a Liveaction Omnipliance TL. Omnipeek’s expert system immediately alerts on irregularities on OSI layers 2 to 7. These alerts can be sorted based on any of the available columns, e.g. by number, layers, etc. In this case, we sort by number and are thus able to identify TCP retransmissions, “non-responsive” peer alerts, slow acknowledgements, etc.

Figure 1: Omnipeek expert system with flows categorised by protocols/applications and expert events sorted by number of occurrences.

Figure 2: A graph of total utilisation with second-by-second resolution along with the most used applications.

When the network load is plotted using typical bps, as is the case in Figure 2, the maximum full duplex peak is 2.54 Gbps, which is not considered a concern for a 10 Gbps connection with a full duplex capacity of 20 Gbps (transmit and receive – 10 Gbps in each direction).

One thing we noticed in the Compass Expert Event summary is that there are quite a large number of events associated with slow network problems, especially when measured at 45 seconds. Compass can graph the occurrence of Expert Events, which shows that there is a commonality in the slope relationship between Expert Events and overall network utilisation:

Figure 3: Omnipeek’s Compass function can display the occurrence of Expert Events.

Since the number of slow network events is quite large, let’s go back to the usage graph to examine the peaks a little more closely. We can do a deeper analysis to thereby see a level of detail in milliseconds, where we could see several spikes of up to 9,845 Mbit per millisecond. Converted to seconds (simply multiplied by 1000), this would be 9.845 Gbps, and should this go in one direction, this will fully utilise our 10 Gig link.

Figure 4: Network utilisation in millisecond granularity with several peaks of up to 10 Mbit per millisecond

Interestingly, in Figure 4, the upper protocol has been changed to CIFS. So what happened?

Figure 5: The usual utilisation by TCP traffic is shown in purple, whereas the CIFS peaks have been marked in brown.

With a normal utilisation of up to 6 Mbit per millisecond of TCP traffic, CIFS spikes of up to 6 Mbit per millisecond can increase the utilisation even to 12 Mbit per millisecond, which exceeds the capacity of a 10 Gbit/s link in one direction altogether. In such a situation, the switches are no longer able to buffer the traffic until the bursts are gone, causing packets to be lost and ultimately causing TCP retransmissions, which the Expert Events clearly demonstrate.

Liveaction Omnipeek provides a very intuitive and cost-effective way to check if microbursts are actually occurring on your network, but also when, where and how much network performance is suffering. If you would like to try a free 30-day trial of Omnipeek today, simply visit our website.

Virtualisation is part of the future of networks

virtualisation

There is arguably no hotter buzzword in the technology industry right now than virtualisation – and for good reason. Organisations are turning to virtualisation in droves to reduce capacity and energy costs associated with running a traditional hardware network.

Yet, nearly 60 per cent of organisations have seen a slowdown in their virtualisation efforts, according to a report by Nemertes Research. Even though organisations and businesses are reaping some of the benefits of virtualised networks, many of them are probably not making the most of them.

Network engineers know all too well that a virtual topology is fundamentally different from architectures of the past. In a virtual network, traffic never comes into contact with the physical network, where it is easier to capture and analyse. In other words: Network monitoring is a completely different “animal” in a virtual environment, requiring the use of completely different tools and resources.

Good network monitoring for virtual environments must be able to monitor critical applications running in virtual environments and should have the ability to notify IT staff as quickly as possible when problems occur. For example, Liveaction’s OmniEngine works as an application on a virtual network and can analyse the traffic flowing between a physical host and virtual machines. In this way, ‘invisible traffic’ also remains latent.

Virtualisation - by Shubham Dhage @ unsplash

As bandwidth requirements continue to rise and data centres dimension themselves accordingly, virtualisation will increase. New trends such as network functions virtualisation (NFV) and software-defined networking (SDN) are gaining momentum, making the monitoring of unconventional networks even more dramatic.

A recent report from Research & Markets indicates that the NFV, SDN and wireless network infrastructure market will grow to $21 billion by 2020.

Chances are, your computing structure is either already running a virtual network or will be transformed in the near future. Make sure you get the optimum. OmniPeek network analysis software is Liveaction’s award-winning solution for monitoring, analysing and troubleshooting networks of all types. As the name suggests, OmniPeek is designed to provide comprehensive visibility into network traffic: local and remote, LAN and WLAN, and for networks at all speeds.

Thank you for your upload