In this concrete test case we used a Xena VulcanBay with 2x 40 Gbps QSFP+ interfaces to test some next-generation firewalls regarding their performance. Specifically, we were interested in the following test scenarios:
- Pure throughput
- High number of connections (session load)
- Use of NAT
- Realistic traffic
- Longer testing periods during which we “pushed” new firewall rules to detect potential throughput breaches
In this article we want to show how we used the Xena VulcanBay including its management, the VulcanManager, and a Cisco Nexus Switch to connect the firewall clusters. We list our test scenarios and give some hints about potential stumbling blocks.
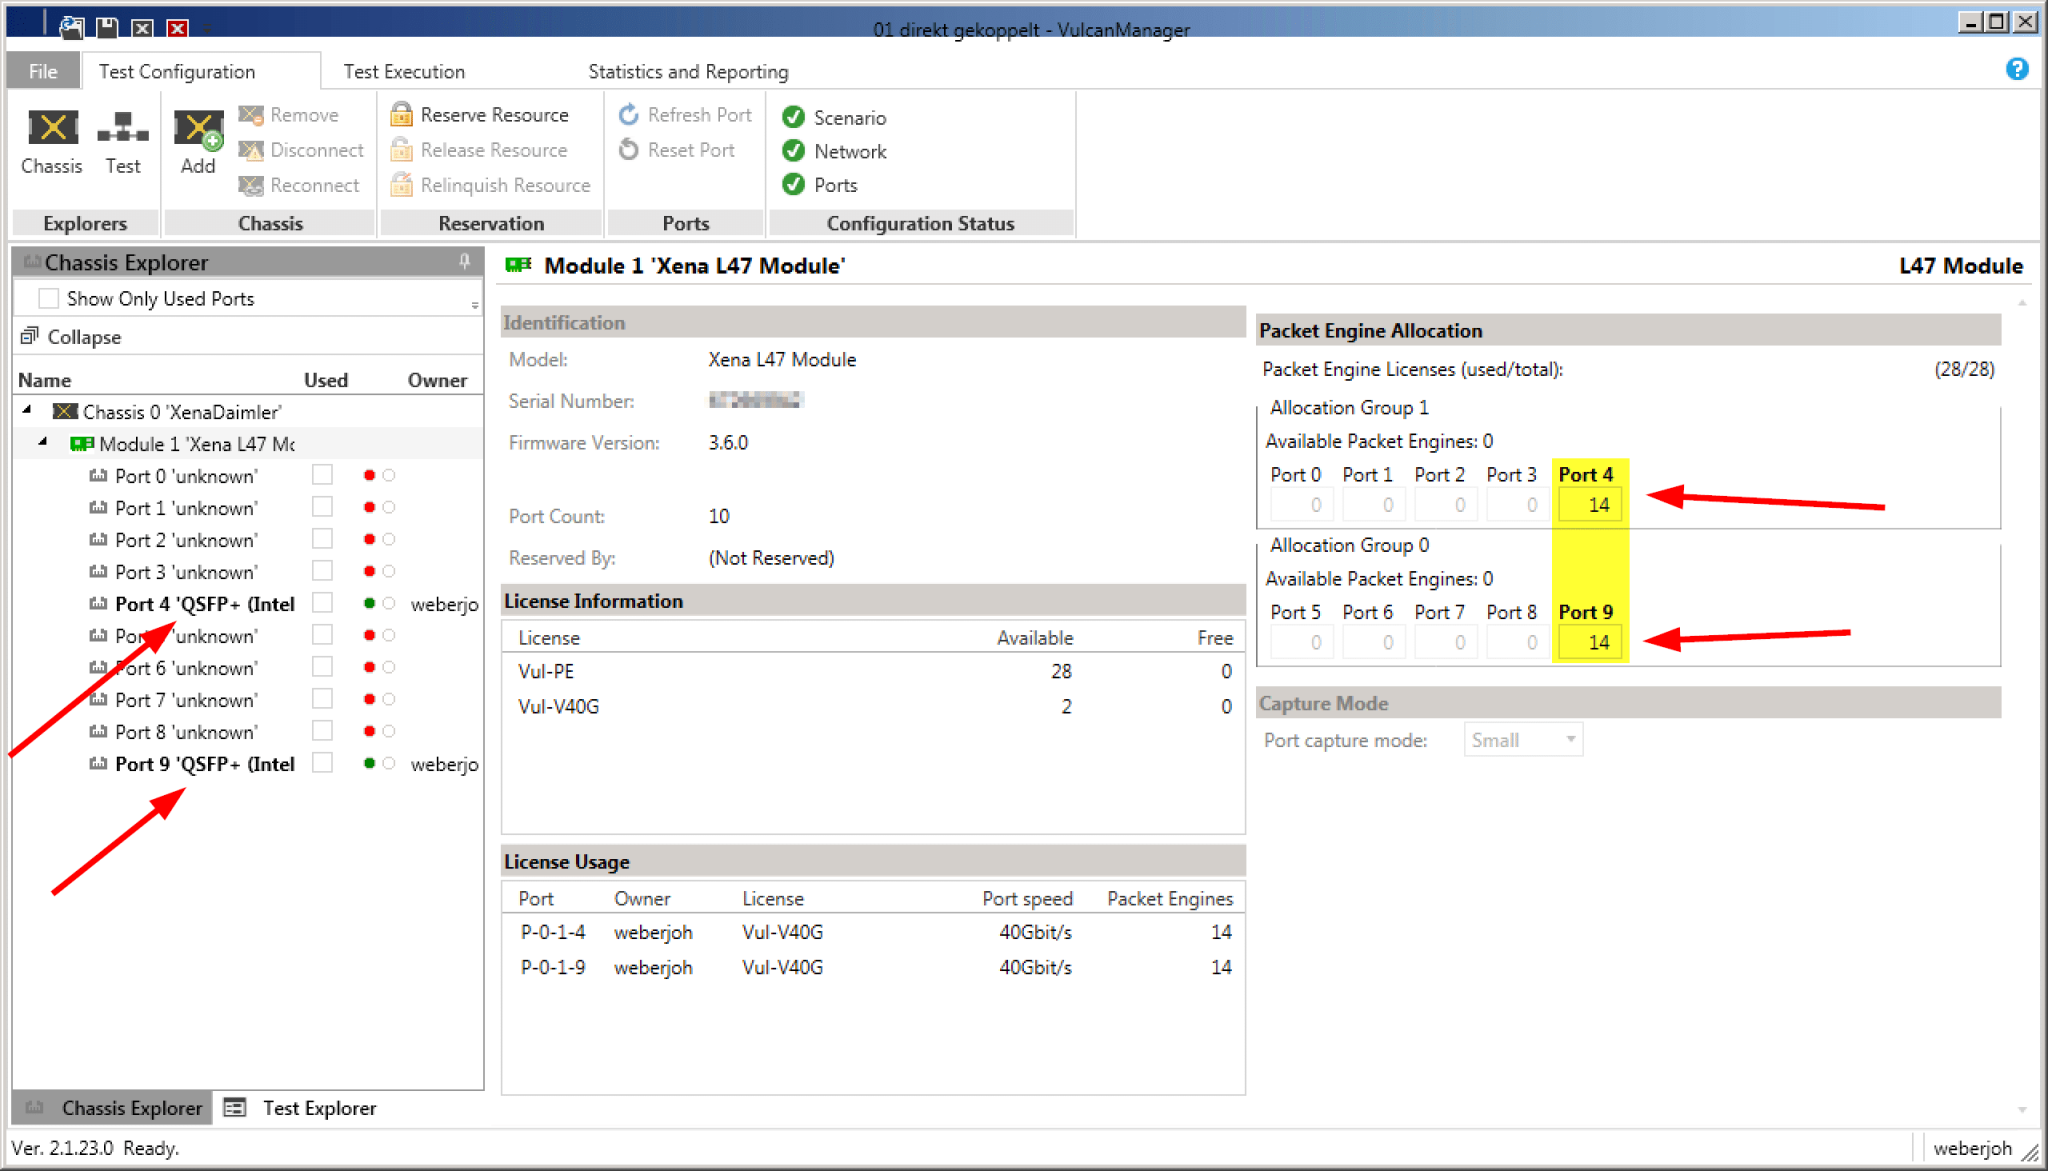
For our tests we had a Xena VulcanBay Vul-28PE-40G with firmware version 3.6.0, licenses for both 40 G interfaces and the full 28 Packet Engines available. The VulcanManager ran on version 2.1.23.0. Since we only used one single VulcanBay (and not several at distributed locations), the only admin user was able to distribute the full 28 Packet Engines equally on these two ports.
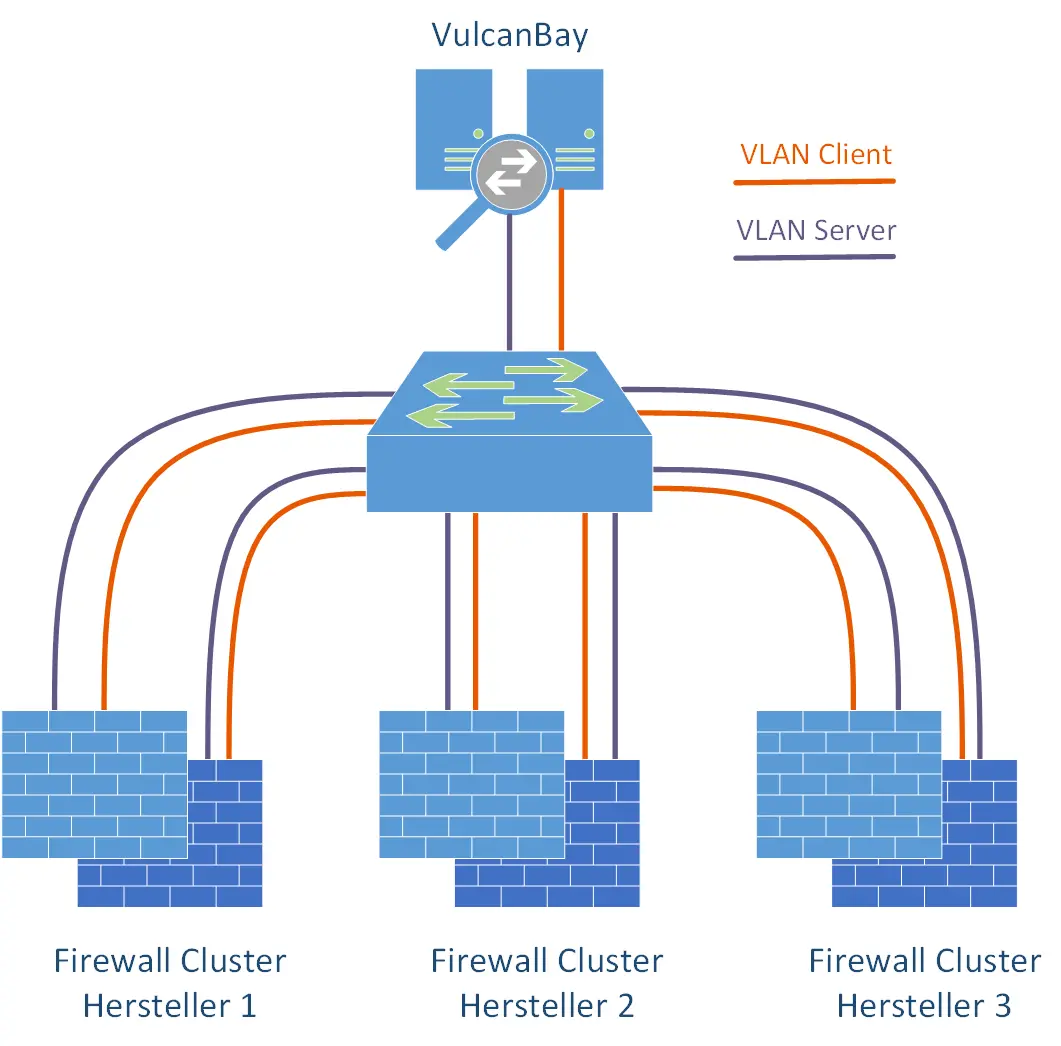
We used a single Cisco Nexus switch with sufficient QSFP+ modules and corresponding throughput to connect the VulcanBay to the respective firewall clusters. Since we had connected all firewall clusters as well as VulcanBay to this switch at the same time, and had always used the same IPv4/IPv6 address ranges for the tests, we were able to decide which firewall manufacturer we wanted to test purely with the “shutdown / no shutdown” of individual interfaces. Thus the complete laboratory was controllable from a distance. Very practical for the typical case of a home office employee. Furthermore, it was so easy to connect VulcanBay “to itself” in order to get meaningful reference values for all tests. For this purpose, both 40 G interfaces to VulcanBay were temporarily configured in the same VLAN.
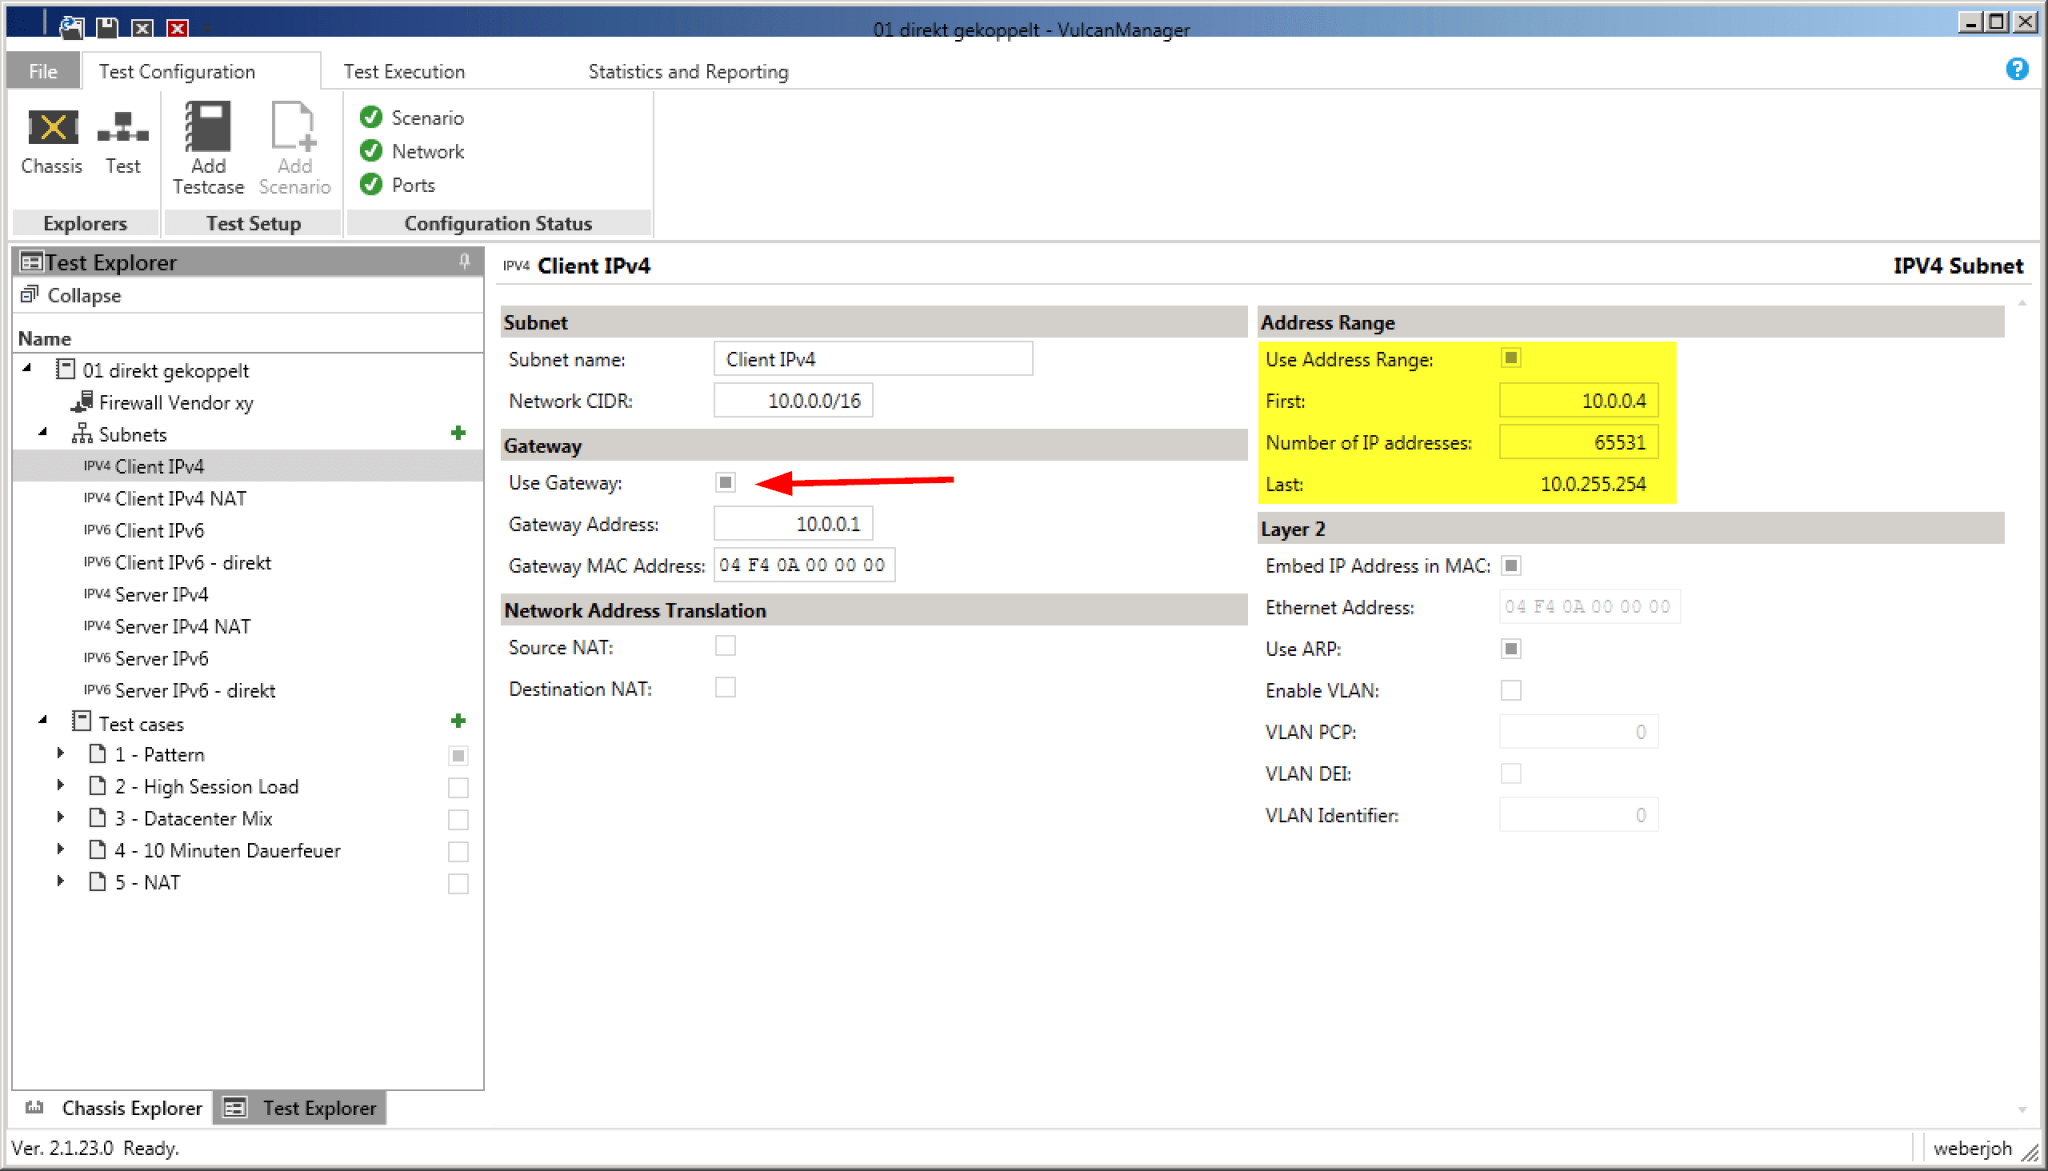
In our case we wanted to test different firewalls in Layer 3 mode. In order to integrate this “Device Under Test” (DUT) routing we created appropriate subnets – for the outdated IPv4 protocol as well as for IPv6. The IP subnets simulated by VulcanBay are then directly attached to the firewall. In the case of a /16 IPv4 network, exactly this /16 network must also be configured at the firewall. Especially important is the default gateway, for example 10.0.0..1 for the client IPv4 network. If you additionally use the option “Use ARP” (right side), you do not have to worry about the displayed MAC addresses. The VulcanBay resolves these itself.
The same applies to IPv6. Here the network is not entered in the usual slash notation, but simply the gateway and the address range are determined. Via “Use NDP” the VulcanBay automatically resolves the Layer 2 MAC address to the Layer 3 IPv6 address.
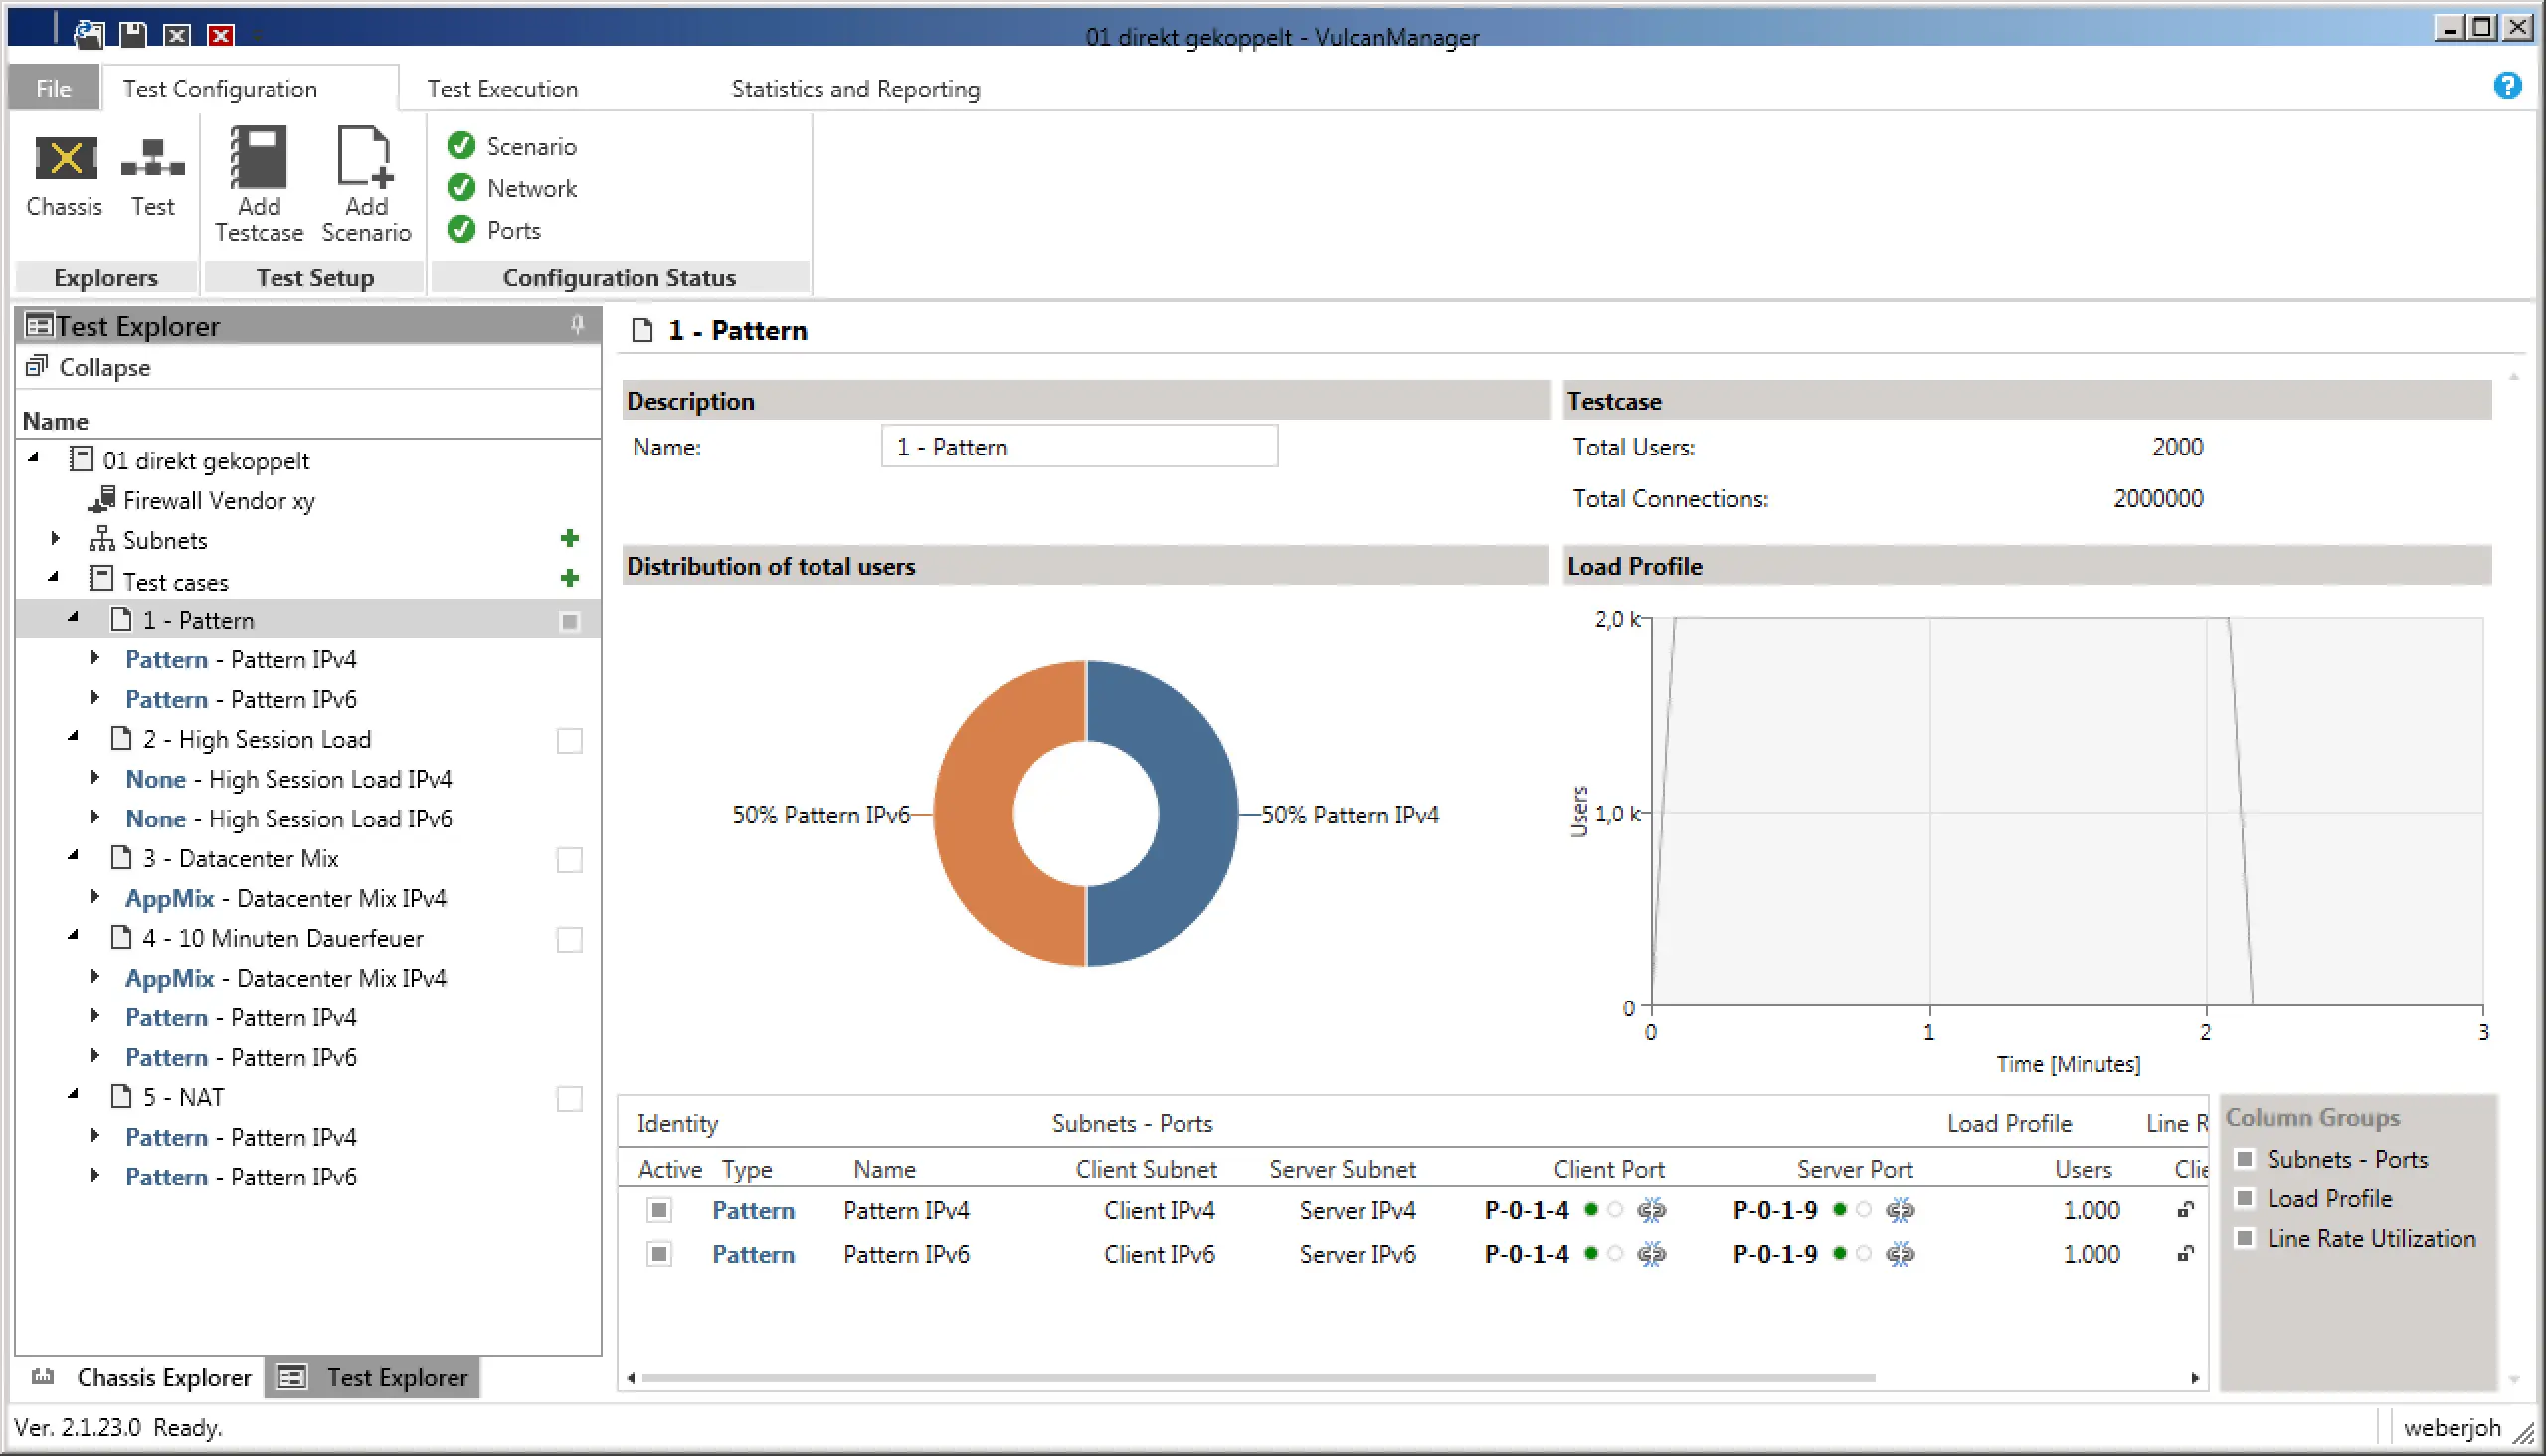
1) Pure throughput: In the first test scenario, we were purely concerned with the throughput of the firewalls. For this we chose the “Pattern” scenario, once for IPv4 and once for IPv6, which automatically sets the ratio to 50-50. In the settings we have additionally selected “Bidirectional” to push through data in both directions, i.e. duplex, in both cases. So we could reach the maximum throughput of 80 G with the 2x 40 G interfaces. In order to distribute the bandwidth over several sessions (which in real life is the more realistic test case), we selected 1000 users, who should establish connections from 100 source ports to 10 servers each. Makes 1 million sessions each for IPv4 and IPv6. With a ramp-up time of 5 seconds, i.e. a smooth increase of the connections instead of the immediate full load, the pure test ran through 120 seconds afterwards, before it also had a ramp-down time of 5 seconds.
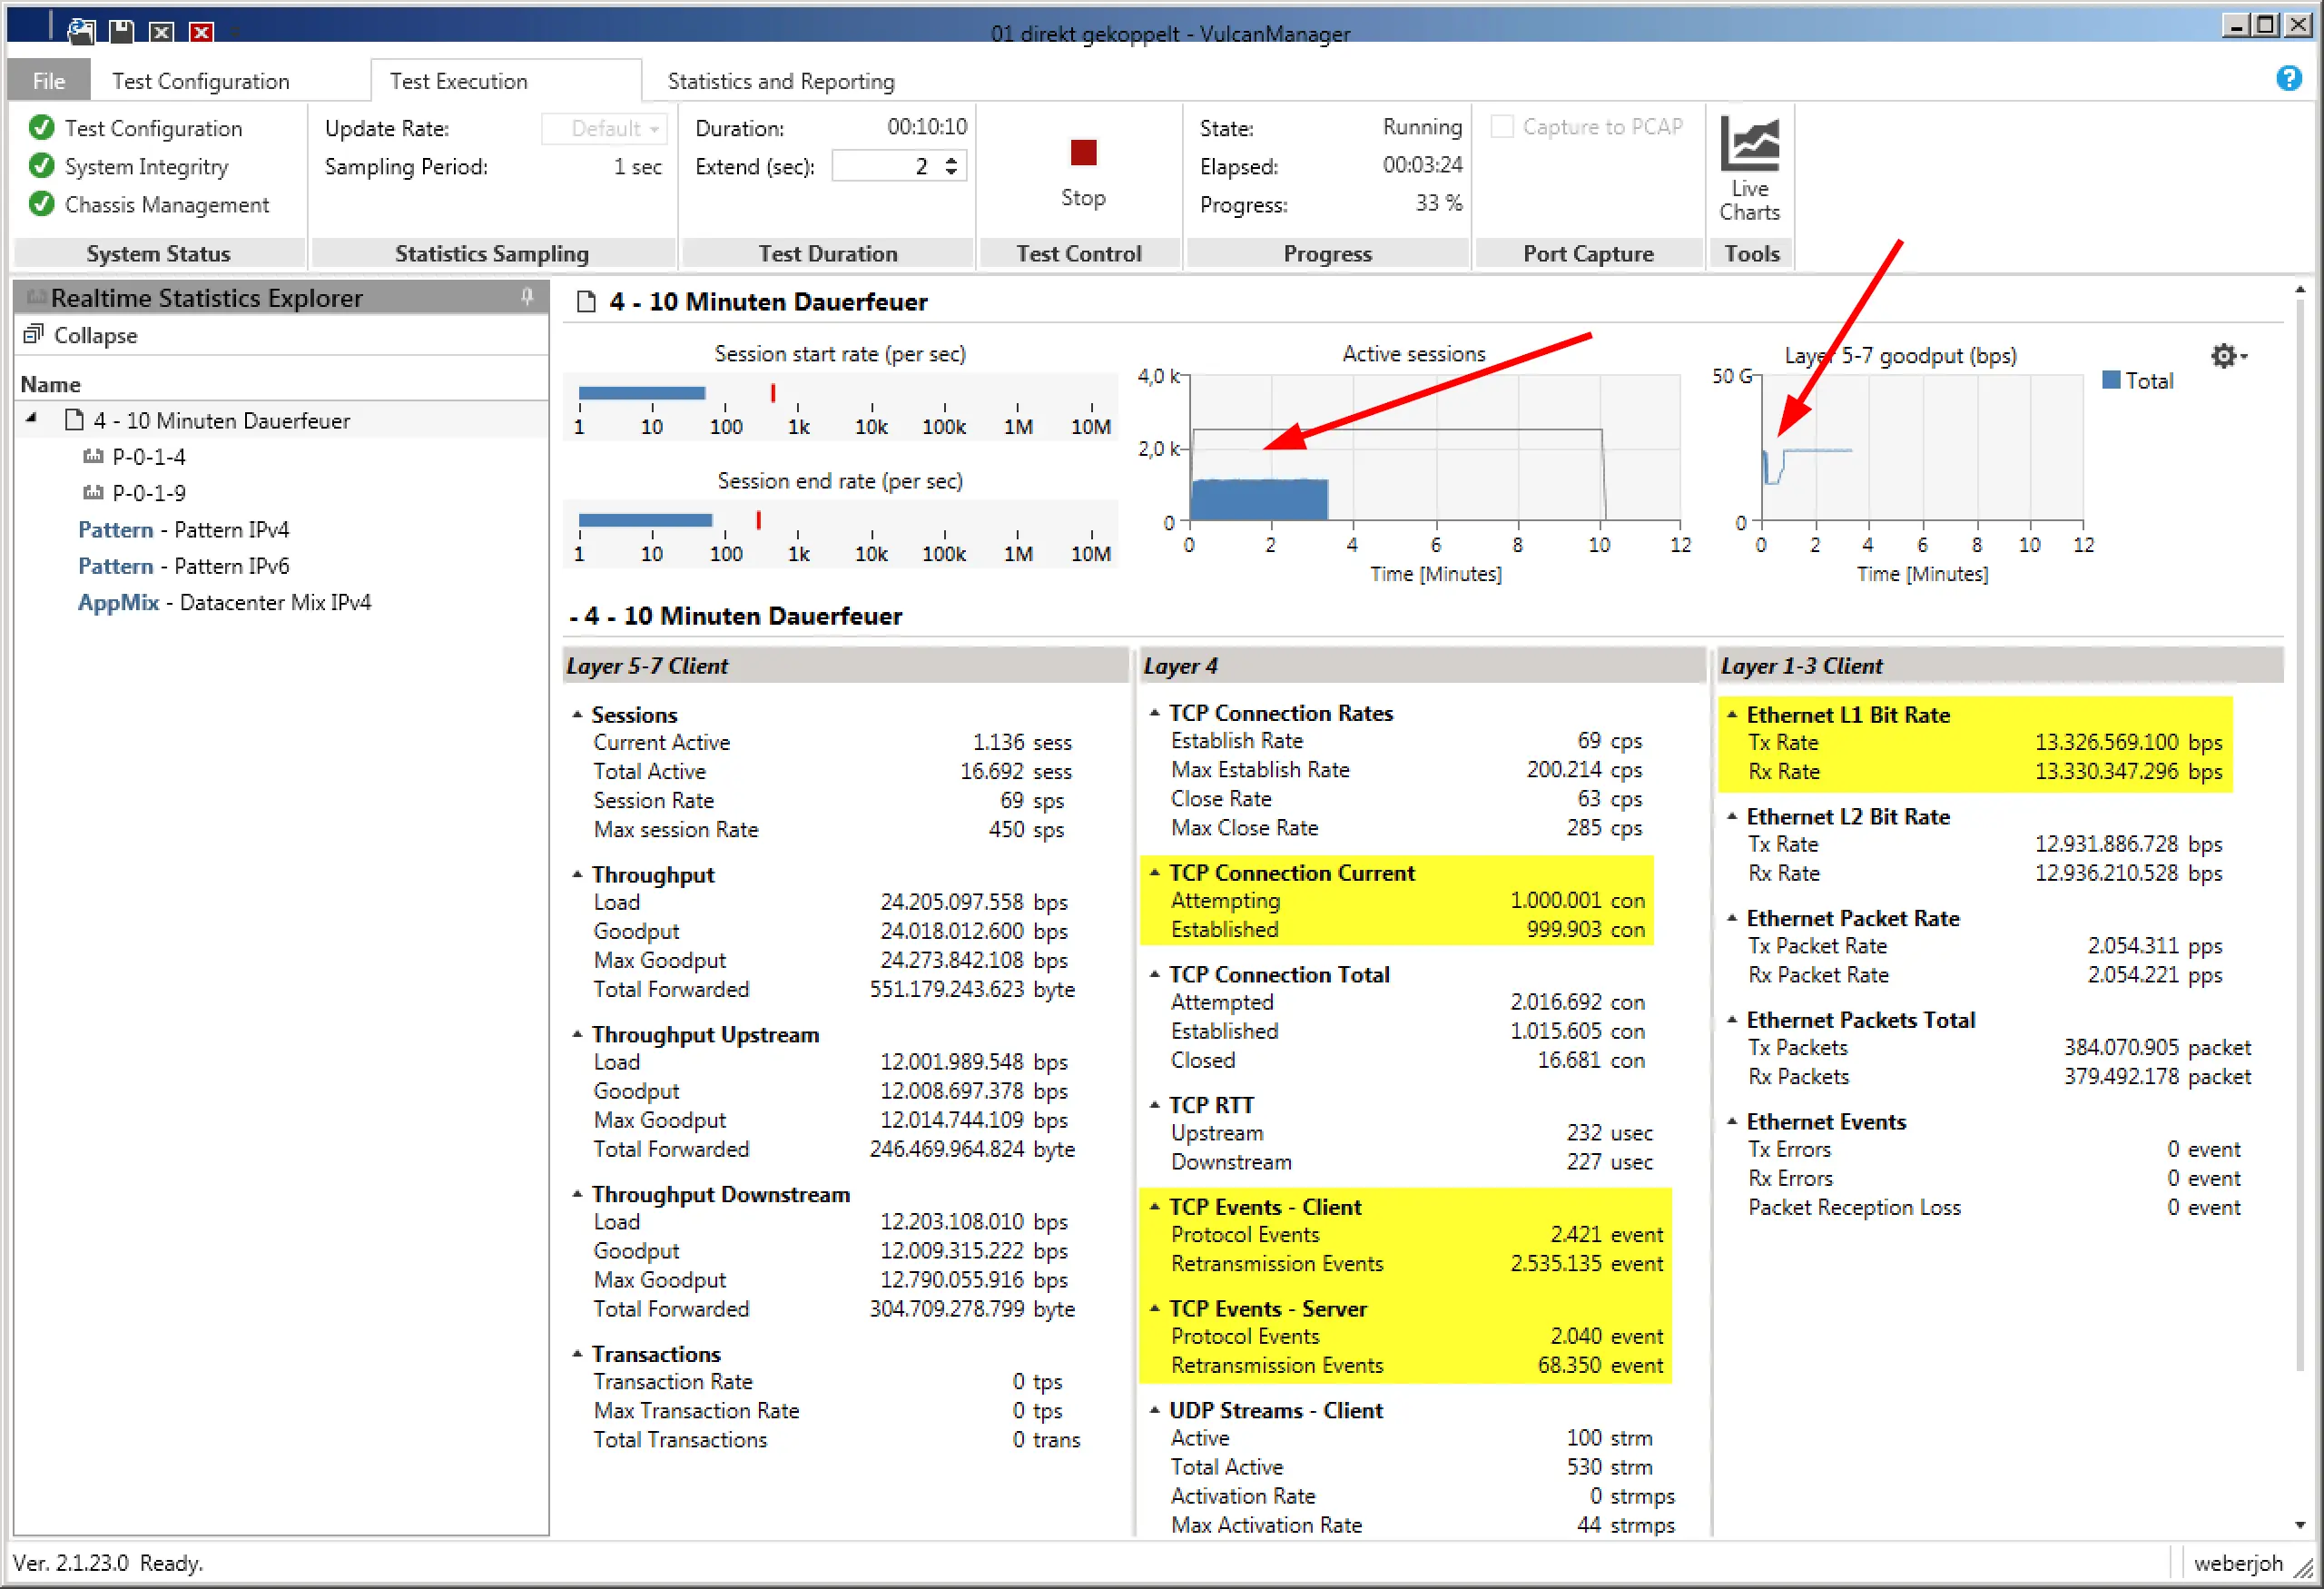
During the test, the VulcanManager already displays some useful data, such as TCP Connections or Layer 1 throughput. By means of the graphics in the upper area, one gets a good impression at a glance. In the following screenshot you can see that the number of active connections is less than half of the planned one (bad), while Layer 5-7 Goodput has an unattractive kink at the beginning of the test. Both problems turned out to be errors in the IPv6 implementation of the tested device.
2) High number of connections (session load): Also for IPv4 and IPv6, 20 million parallel TCP sessions were established and maintained during this test. Not only the sum of the sessions was relevant, but also the short ramp-up time of only 30 seconds, which corresponded to a setup rate of 667,000 connections per second! The sessions were left standing for 60 seconds, but without transferring any data. Over a further 30 seconds they were terminated again, typical for TCP via FIN-ACK. The aim was that the firewalls to be tested would firstly allow the connections to pass through cleanly and secondly they could also dismantle them cleanly (and thus free up their memory).
3) NAT scenarios: The same test as under 1) was used, with the only difference that the IPv4 connections from the client network to the server network were provided with a source NAT on the firewalls. The goal was to find out if this would cause a performance degradation of the firewalls.
4) Realistic Traffic: With a predefined “Datacenter Mix” we were able to simulate the flow of two HTTPS, SMB2, LDAP and AFS (via UDP and TCP) connections for several thousand users with just a few clicks. This was not about a full load test of the firewalls, but about the set-up and dismantling speeds as well as the application detections. Depending on whether the app IDs of the firewalls were activated or deactivated, there were major differences here.
5) 10 minutes of continuous fire with commits: This somewhat more specific test consisted of scenarios 1 and 4, i.e. full load (1) with constant session setup and shutdown (4) at the same time. This ran constantly for 10 minutes, while we installed another 500 rules on each firewall. Here we wanted to find out if this process creates a measurable kink in throughput on the firewalls, which was partly the case.
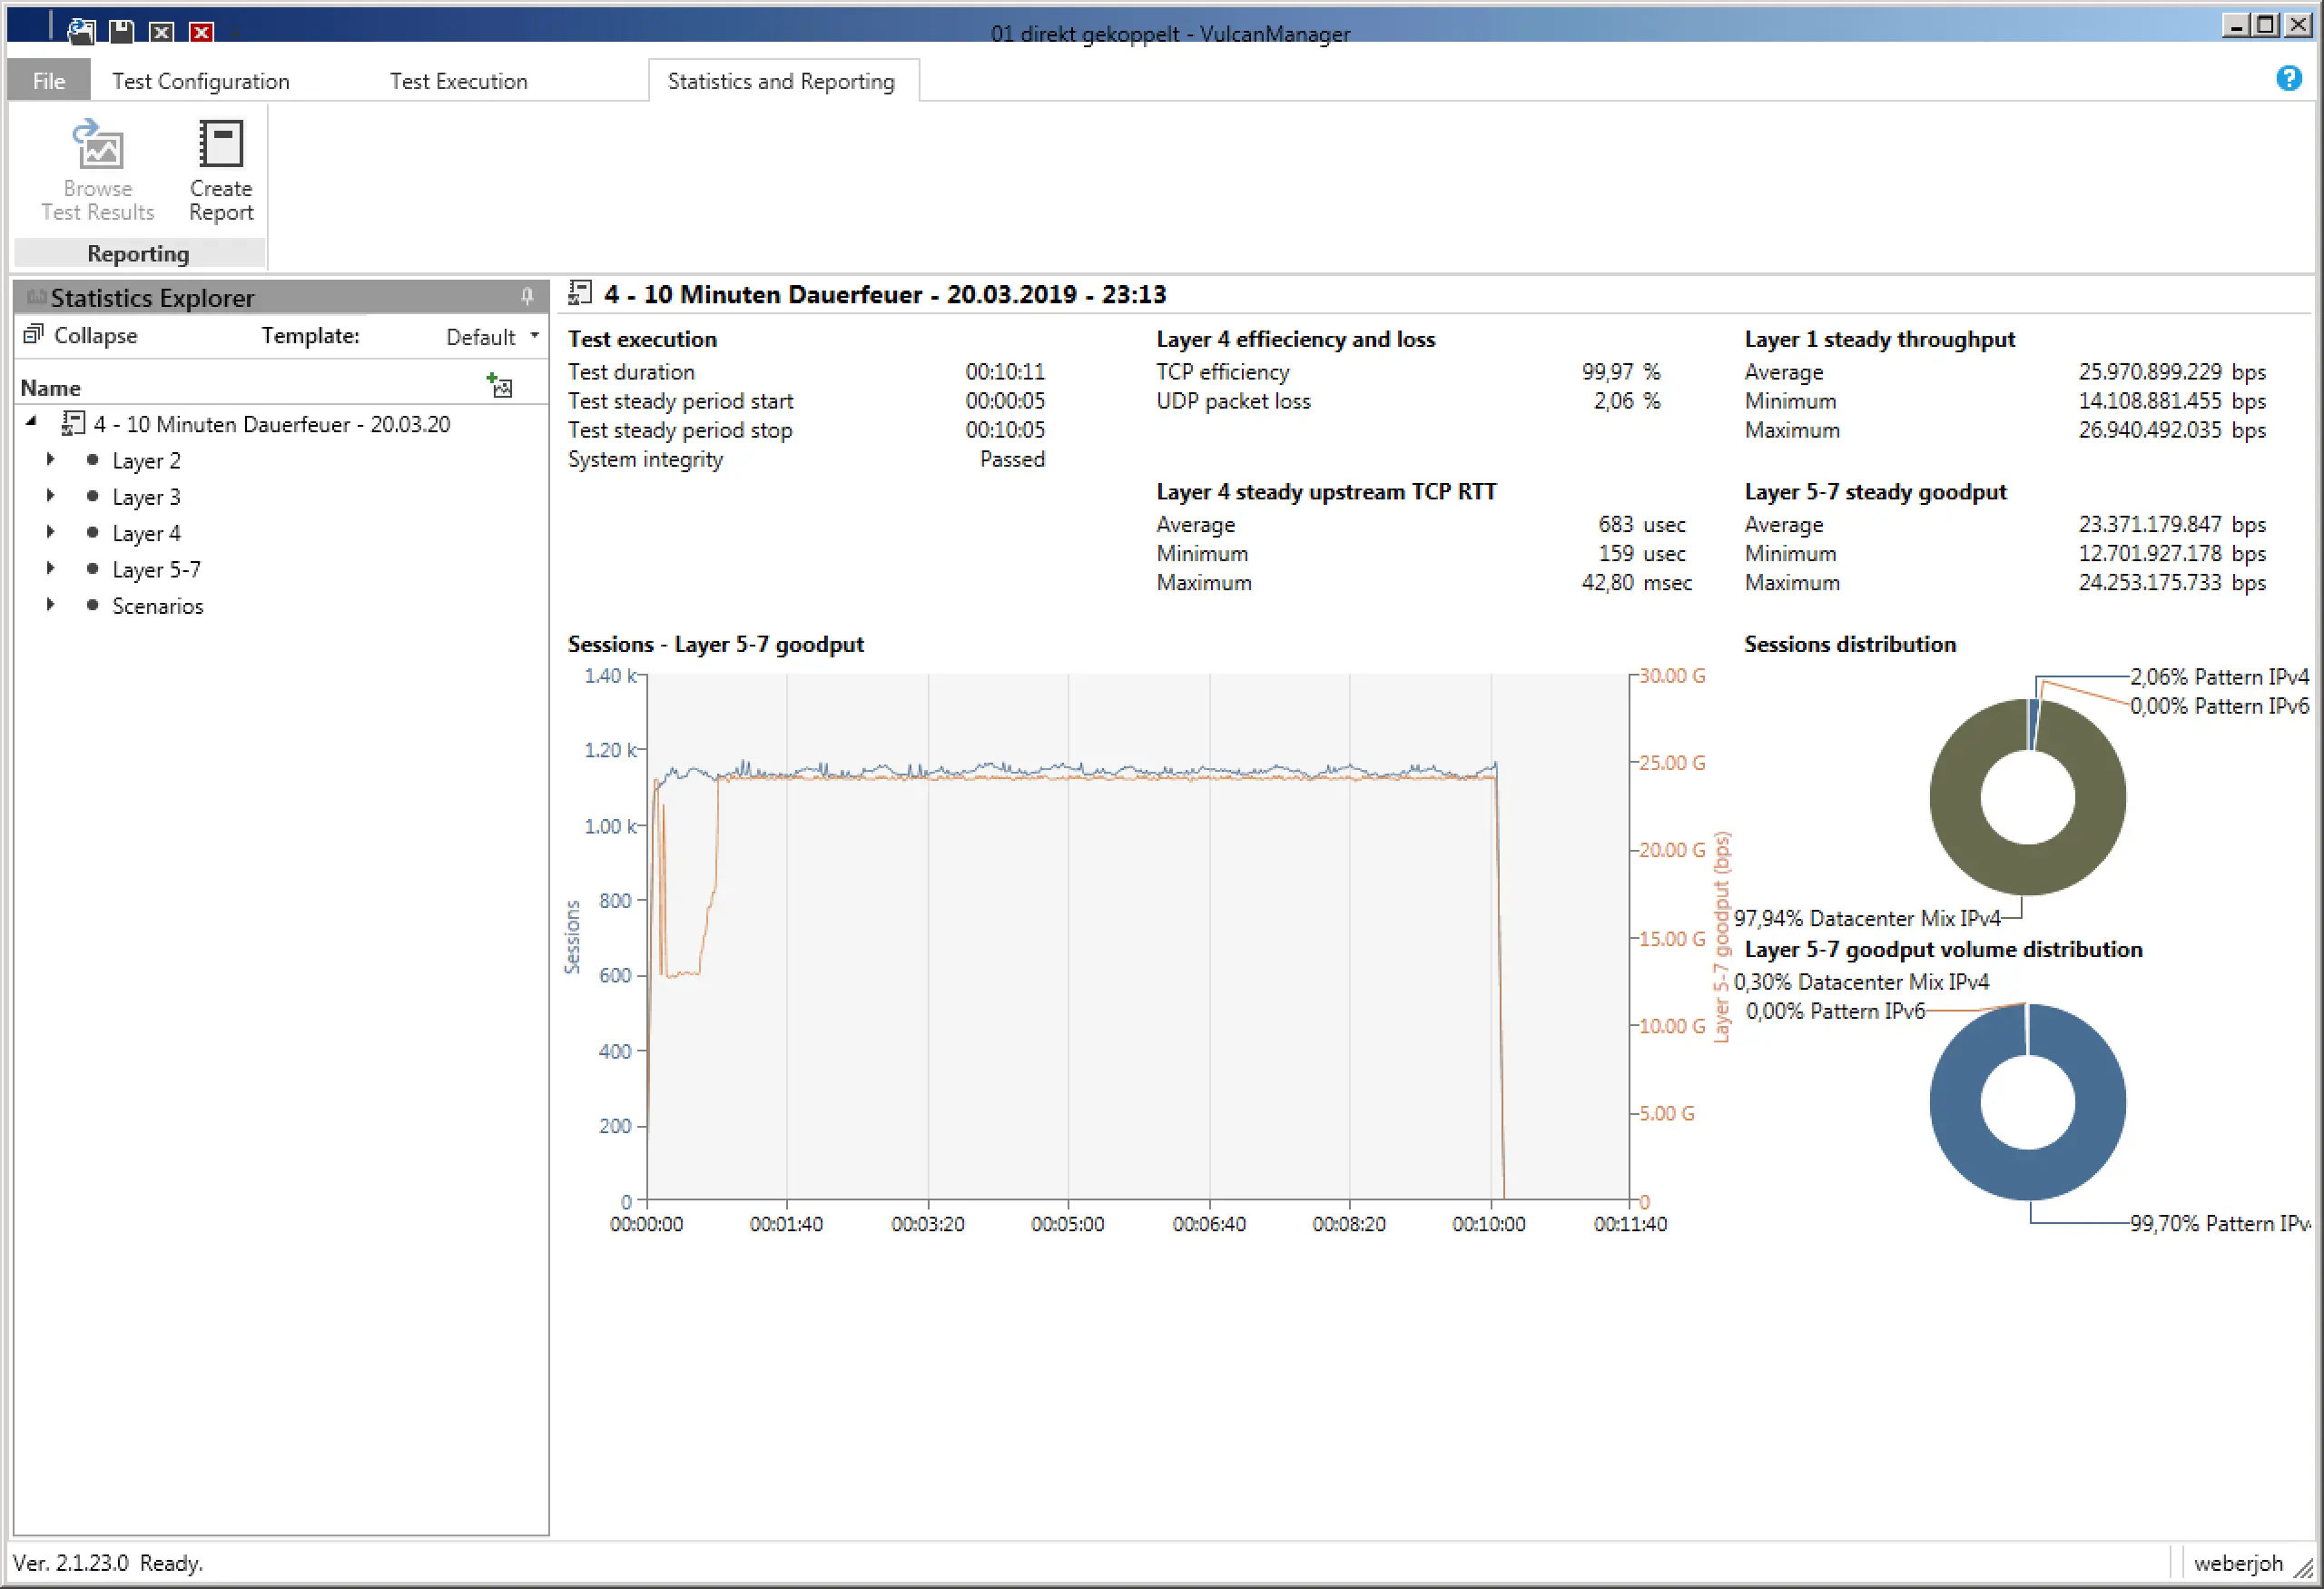
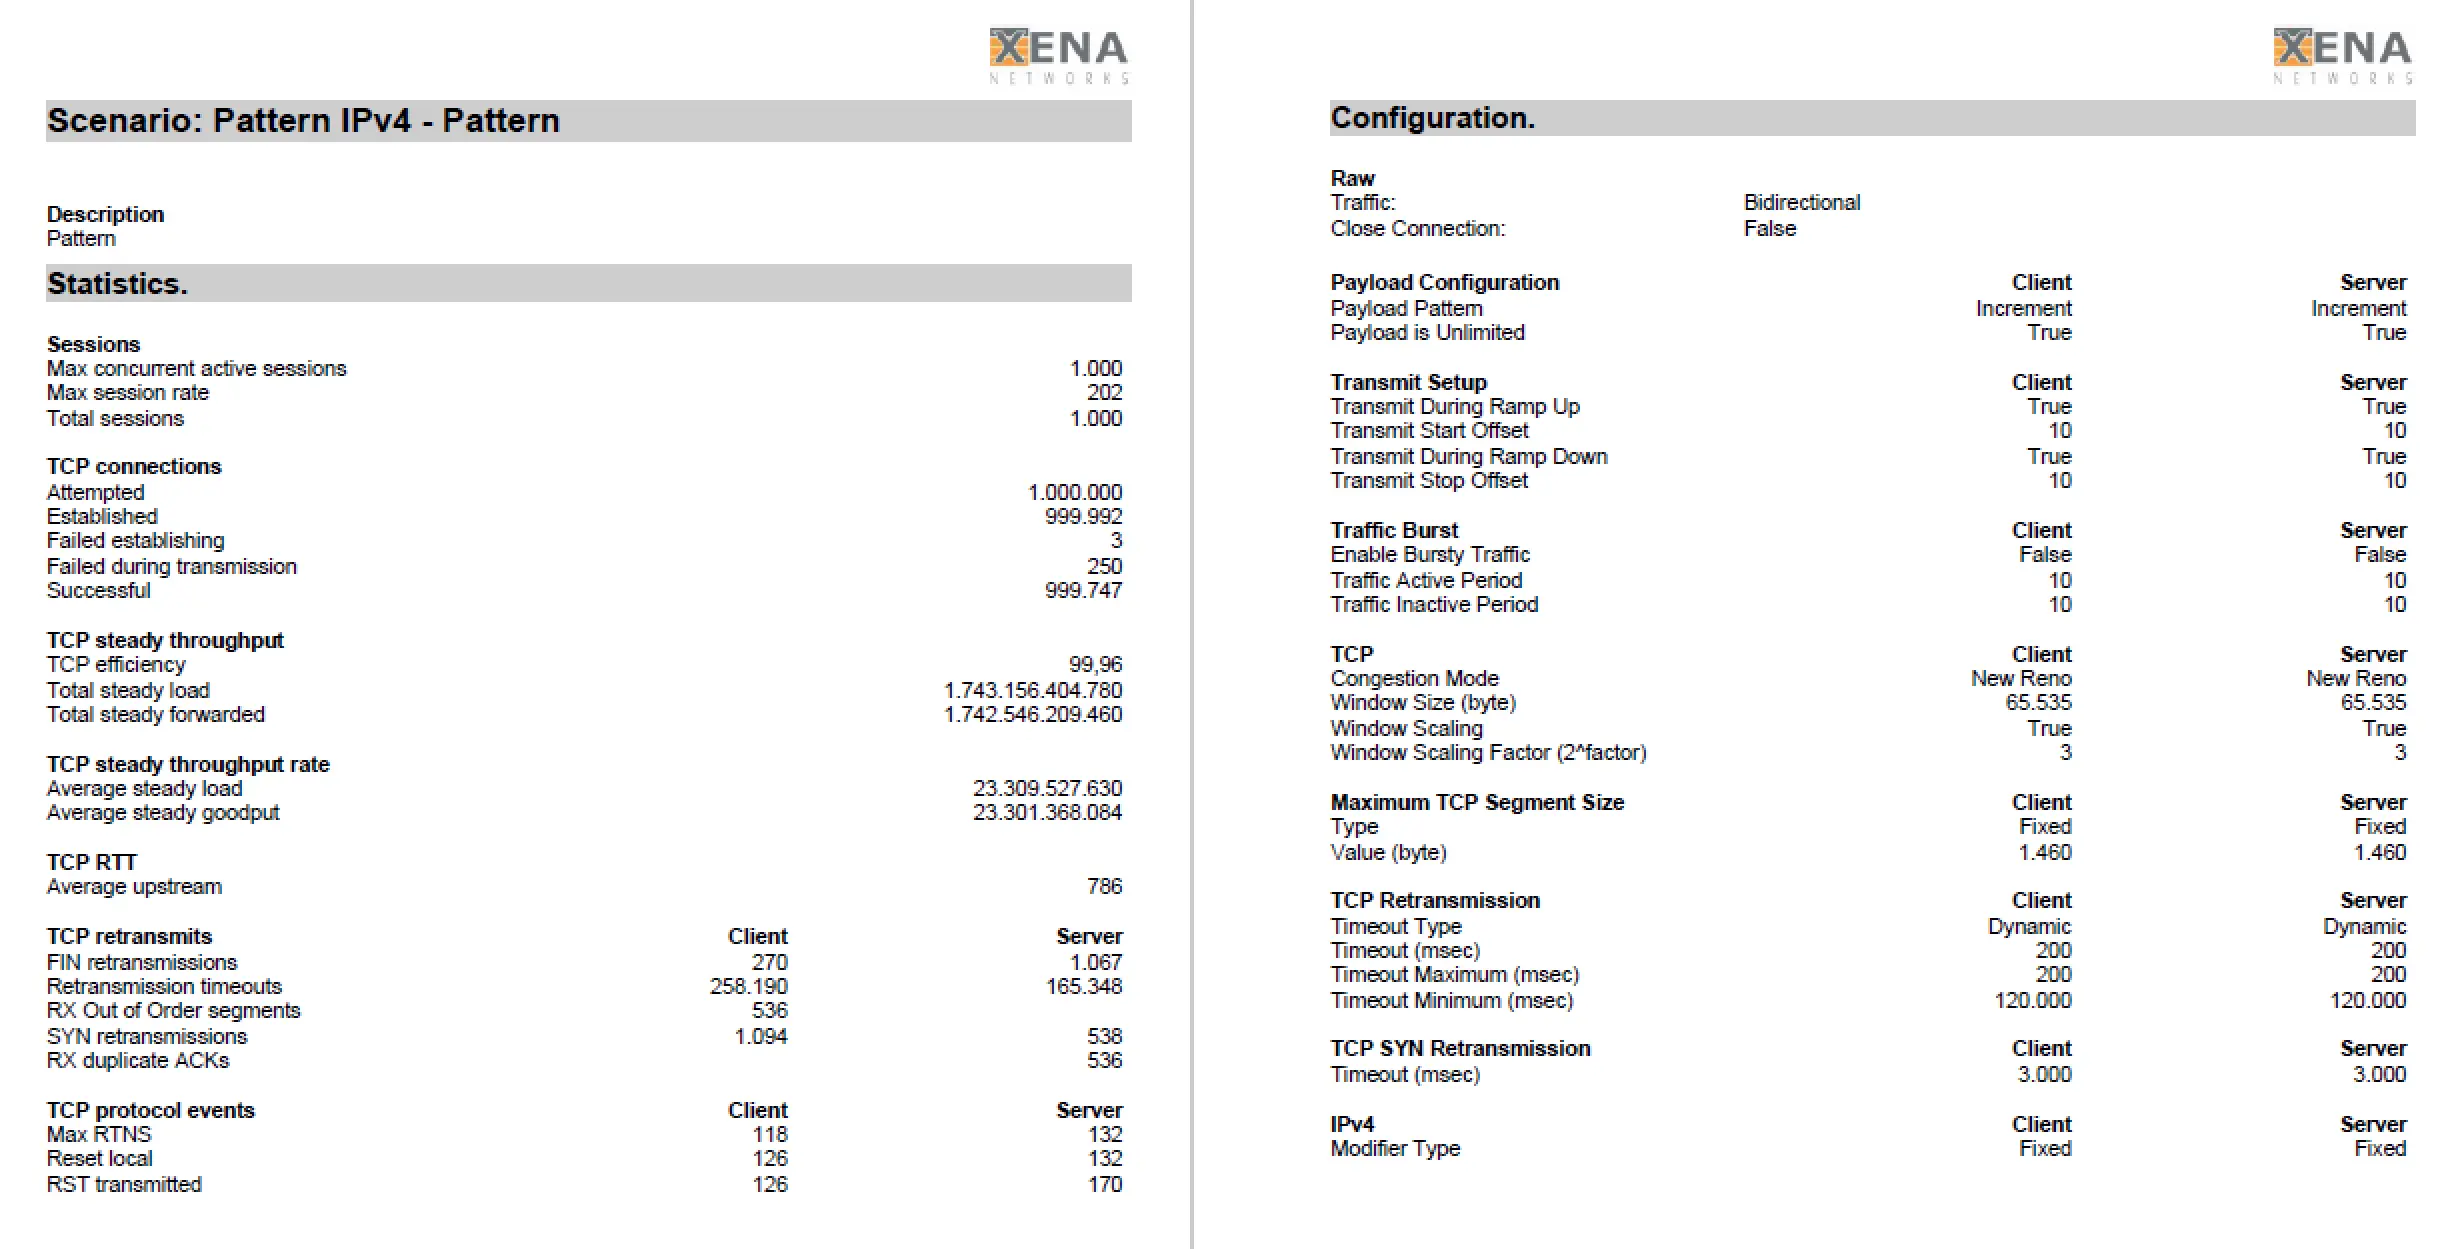
At the end of each test, VulcanManager displays the Statistics and Reporting page with all possible details. By “Create Report” you can create a PDF, which contains besides all details also information about the selected test scenario as well as information about the tested device. The challenge is to distinguish the relevant numbers from the less relevant ones and place them in the right context to get meaningful results. During our comparisons of different Next-Generation Firewalls we restricted ourselves to the “Layer 1 steady throughput (bps)” for the throughput test, or the “Successful TCP Connections” for the connection test. Compared to the reference values at which the VulcanBay was connected to itself, this already yielded meaningful comparable results that could be easily displayed both in table form and graphically.
Note that VulcanManager has some other interesting features that we did not use in this case study, such as TLS Traffic (for testing TLS interception) and Packet Replay (for testing custom and more specific scenarios extracted from uploaded PCAPs). Also we have not used many application or protocol oriented test scenarios like Dropbox, eBay, LinkedIn or HTTPS, IMAP, NFS. This is due to our testing purposes, which were strongly focused on pure throughput and number of sessions.
The VulcanBay from XENA Networks is the ideal test device for comparing various next-generation firewalls. Within a very short time we had configured and tested various test scenarios. Only the abundance of test results was initially overwhelming. The trick was to concentrate on the relevant information.

