Network packet analysis is a great method for diagnosing network problems. The data in the network or on the affected devices is recorded and examined with special analysis devices. This technique gives you a deep insight into the data packets and allows you to identify and correct errors very precisely.
Network analysis by means of “capturing” procedures is one of the most reliable analysis methods, as you receive unaltered information from the corresponding network connections to your network, server, client and application and can evaluate this data without loss and without interference. The data to be analysed is passed on completely and transparently from so-called Network TAPs to the analyser while maintaining data integrity.

Measuring point - Single or Multiple?
A SPAN port is often used as a measuring point, as it requires the least installation effort to access the relevant network data. The better measuring point is a network TAP.
I have described the advantages of Network (Ethernet) TAPs in my previous article and I assume that you are familiar with them. Certainly, it is possible to investigate the cause of the problem using a single measurement point on the network, but to determine the location of the problem, additional measurement points can be beneficial.
Depending on where you record the data, you get a different picture of the communication. Especially to determine “one-way-delay” or the location of packet loss, it is advisable to consider several measurement points. In addition, the use of several analysis points can significantly increase the quality of the measurement and problem analysis.
In this way, the recorded data can be conveniently compared with each other and latency, one-way delay, packet losses and other important parameters can be determined. Without a doubt, standard errors can also be limited or diagnosed with only one measuring point, but due to increasingly complex network infrastructures, there are significant advantages to multi-point analysis. You determine the capture points yourself and can thus more easily and accurately analyse the transport path of the packets and diagnose the identification of problem areas more quickly. Detecting anomalies and getting your network back on track becomes child’s play.

How does a multi-segment analysis work?
With this method, the network data is examined at several points in the network and compared with each other. However, especially with multi-segment analysis, time synchronisation is immensely important, as the result is strongly influenced and falsified by unclean methods. If I want to measure latency and delays precisely and accurately, then I need hardware with which I can capture the packets with nanosecond precision and provide them with an absolute time.
With special network capture cards that use FPGA to record the data, it is now possible to record data packets with 8ns accuracy. This method is also called time stamping and is supported by all professional analysis and measurement tools. But even without such FPGA cards, it is possible to perform multi-point analyses, namely by correlating the data at an analysis point, e.g. recording with Link Aggregation TAPs, or using OmniPeek Enterprise for analysis.
If the data is aggregated during the capture, it is important to mark the data traffic with a VLAN tag beforehand or to mark the measuring points directly during the capture in order to be able to recognise the origin of the data during the analysis. It is not uncommon to prefer the fast way of capturing data for time reasons and to collect the network data on the affected systems.
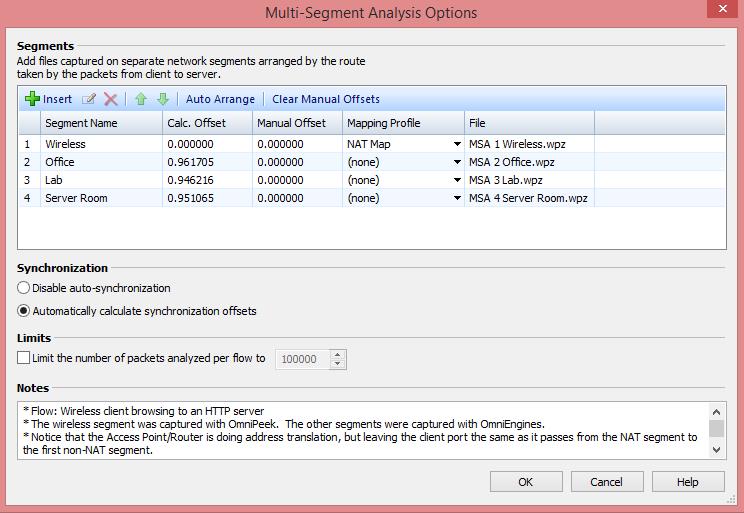
Tools such as TCPDump or Wireshark (PCAP) can be used, or the OmniPeek Remote Assistant can be consulted for help. If the trace data is now available from different systems (TAP, client, server, etc.), a correction of the absolute time is required, as otherwise an analysis is almost impossible. A special function in OmniPeek Enterprise allows you to manually correct the time differences between the different trace files by means of offset adjustments. OmniPeek will gladly take over this task for you and synchronise the time intervals so that you can concentrate on the essentials.
The more measurement points I want to roll out in the network, the more network interfaces are needed on the analysis computer. In our example we assume 4 measuring points. In this setup, the data is available in 4-fold form and must be written away accordingly. If you are only interested in the data of a single application, you can use filters to ignore the unwanted traffic before capturing and reduce the load on the analysis tool.

What is the advantage of multi-segment analysis?
Now it is about increasing the quality of the measurement and gaining valuable information from the network. Ideally, the data should be collected once at the client and once at the server and the other measuring points should be placed in the network, e.g. in the distribution and core area.
This would technically enable us to analyse the data packets and transactions from a certain client to the server in detail and to localise the location of possible errors. Proxies and many other security tools can cause latency or other critical errors due to performance problems, and these must be identified.
Why do retransmissions occur and what causes them? Where do packet losses occur and what is the cause; is it passive components or are network components to blame? If I have latency or jitter, I want to know where exactly it is occurring. These and many other questions can be answered by means of a multi-segment analysis.

Application of the multi-segment analysis
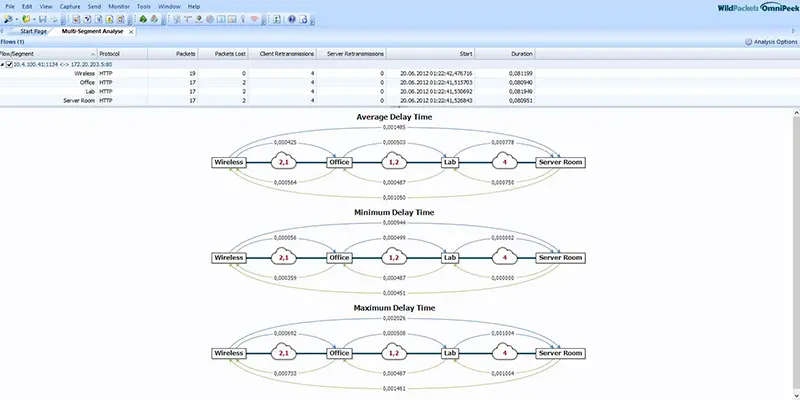
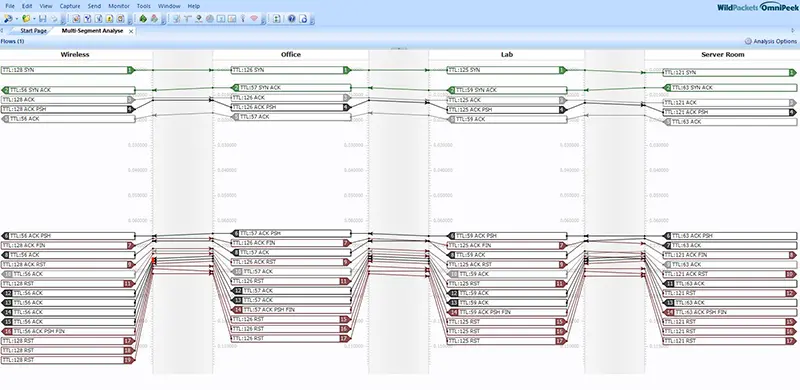
Nowadays, there are analysis tools that allow automated multi-segment analysis and eliminate the need to manually sift through packets. Fortunately, the OmniPeek product supports multi-segment analysis and shows you the paths of the packets graphically, simplifying the analysis of this data. The network data is displayed correlated on one screen together with the packet paths and the individual hops.
You can see the latencies caused and the packet losses that have occurred at a glance, without having to analyse them intensively. The valuable thing about this is that you can immediately see where the latencies and packet losses occur and, above all, in which direction. Furthermore, the routes and hops of network packets can be analysed and the runtimes or the quality or convergence time of HA connections can be measured.
Especially with real-time applications like VoIP, I would like to know where jitter or delay occurs. Especially with VoIP it is not difficult to detect quality problems, but to locate them precisely is usually a difficult challenge for a network administrator. Also the latency or other network errors between the WLAN and the LAN network can be measured and diagnosed with OmniPeek’s multi-segment analysis.
Proactive not reactive
Therefore, it is advantageous for network analyses and troubleshooting tasks to have fixed measuring points in the network, through which one can easily access the network packets if necessary. Furthermore, a proactive analysis is very helpful, as errors often occur and disappear again a short time later.
Especially in the case of sporadically occurring errors, it is very advisable to have fixed measuring points and to record the data for a certain period of time. This makes troubleshooting much easier and allows you to quickly identify errors that occurred in the past. Otherwise, you are in the dark and may not be able to isolate the error because it is no longer present or only occurs during certain events.
