Author Archives: Timur Özcan

How to analyse microbursts with Liveaction Omnipeek

A microburst is a local and sudden downburst (downdraft) within a thunderstorm, usually with a diameter of 4 km, although this is usually much smaller. Microbursts can cause significant damage to the surface and in some cases can even be life-threatening.

In computer networks, a microburst is defined as a brief rush of data that typically lasts only milliseconds, but which overloads the link (Ethernet, Gigabit, 10 Gigabit, etc.). A microburst is a serious concern for any network because even a short term network overload means that some users will not be able to access the network. Because the industry standard for measuring network usage is displayed in bits per second (bps), microbursts often go undetected because they are compensated for during the measurement process. In most cases, traditional network monitoring systems do not report such congestion because it is not present for more than a full second.

The end-user’s experience can be significantly limited if there is too much network traffic or performance bottlenecks caused by a slow data flow or connection failure.

Identifying a microburst requires accurate measurement of network traffic on a link with a microsecond granularity and visualisation in milliseconds. Here is a practical example of how to identify a microburst.

In this example, the measurement point is on a TAP inserted into a 10 Gbit/s link on a data centre link. We measured 45 seconds of network traffic using a Liveaction Omnipliance TL. Omnipeek’s expert system immediately alerts on irregularities on OSI layers 2 to 7. These alerts can be sorted based on any of the available columns, e.g. by number, layers, etc. In this case, we sort by number and are thus able to identify TCP retransmissions, “non-responsive” peer alerts, slow acknowledgements, etc.

Figure 1: Omnipeek expert system with flows categorised by protocols/applications and expert events sorted by number of occurrences.

Figure 2: A graph of total utilisation with second-by-second resolution along with the most used applications.

When the network load is plotted using typical bps, as is the case in Figure 2, the maximum full duplex peak is 2.54 Gbps, which is not considered a concern for a 10 Gbps connection with a full duplex capacity of 20 Gbps (transmit and receive – 10 Gbps in each direction).

One thing we noticed in the Compass Expert Event summary is that there are quite a large number of events associated with slow network problems, especially when measured at 45 seconds. Compass can graph the occurrence of Expert Events, which shows that there is a commonality in the slope relationship between Expert Events and overall network utilisation:

Figure 3: Omnipeek’s Compass function can display the occurrence of Expert Events.

Since the number of slow network events is quite large, let’s go back to the usage graph to examine the peaks a little more closely. We can do a deeper analysis to thereby see a level of detail in milliseconds, where we could see several spikes of up to 9,845 Mbit per millisecond. Converted to seconds (simply multiplied by 1000), this would be 9.845 Gbps, and should this go in one direction, this will fully utilise our 10 Gig link.

Figure 4: Network utilisation in millisecond granularity with several peaks of up to 10 Mbit per millisecond

Interestingly, in Figure 4, the upper protocol has been changed to CIFS. So what happened?

Figure 5: The usual utilisation by TCP traffic is shown in purple, whereas the CIFS peaks have been marked in brown.

With a normal utilisation of up to 6 Mbit per millisecond of TCP traffic, CIFS spikes of up to 6 Mbit per millisecond can increase the utilisation even to 12 Mbit per millisecond, which exceeds the capacity of a 10 Gbit/s link in one direction altogether. In such a situation, the switches are no longer able to buffer the traffic until the bursts are gone, causing packets to be lost and ultimately causing TCP retransmissions, which the Expert Events clearly demonstrate.

Liveaction Omnipeek provides a very intuitive and cost-effective way to check if microbursts are actually occurring on your network, but also when, where and how much network performance is suffering. If you would like to try a free 30-day trial of Omnipeek today, simply visit our website.

Virtualisation is part of the future of networks

virtualisation

There is arguably no hotter buzzword in the technology industry right now than virtualisation – and for good reason. Organisations are turning to virtualisation in droves to reduce capacity and energy costs associated with running a traditional hardware network.

Yet, nearly 60 per cent of organisations have seen a slowdown in their virtualisation efforts, according to a report by Nemertes Research. Even though organisations and businesses are reaping some of the benefits of virtualised networks, many of them are probably not making the most of them.

Network engineers know all too well that a virtual topology is fundamentally different from architectures of the past. In a virtual network, traffic never comes into contact with the physical network, where it is easier to capture and analyse. In other words: Network monitoring is a completely different “animal” in a virtual environment, requiring the use of completely different tools and resources.

Good network monitoring for virtual environments must be able to monitor critical applications running in virtual environments and should have the ability to notify IT staff as quickly as possible when problems occur. For example, Liveaction’s OmniEngine works as an application on a virtual network and can analyse the traffic flowing between a physical host and virtual machines. In this way, ‘invisible traffic’ also remains latent.

Virtualisation - by Shubham Dhage @ unsplash

As bandwidth requirements continue to rise and data centres dimension themselves accordingly, virtualisation will increase. New trends such as network functions virtualisation (NFV) and software-defined networking (SDN) are gaining momentum, making the monitoring of unconventional networks even more dramatic.

A recent report from Research & Markets indicates that the NFV, SDN and wireless network infrastructure market will grow to $21 billion by 2020.

Chances are, your computing structure is either already running a virtual network or will be transformed in the near future. Make sure you get the optimum. OmniPeek network analysis software is Liveaction’s award-winning solution for monitoring, analysing and troubleshooting networks of all types. As the name suggests, OmniPeek is designed to provide comprehensive visibility into network traffic: local and remote, LAN and WLAN, and for networks at all speeds.

TCP Latency

TCP-Throughput-Vs-Latency

Als Latenz (auch Latenzzeit) wird die Zeit bezeichnet, die benötigt wird, um ein Datenpaket über ein Netzwerk zu senden.  
Latenz kann auf unterschiedliche Weise gemessen werden: bidirektional (beide Richtungen), monodirektional (eine Richtung), usw. 
Die Latenzzeit kann von jedem Teilstück der Kommunikationsverbindung, über welche das Datenpaket gesendet wird, beeinflusst werden: den Arbeitsplatz, die WAN-Verbindungen, Router, lokale Netzwerke (LAN), Server … und letztendlich kann diese – für große Netzwerke – durch die Lichtgeschwindigkeit begrenzt sein. 
Die Durchsatzrate ist definiert als gesendete/empfangene Datenmenge innerhalb einer definierten Zeiteinheit. Die UDP-Durchsatzrate wird von der Latenz nicht beeinflusst.  
UDP ist ein Protokoll, das verwendet wird, um Daten über ein IP-Netzwerk zu senden. Eines der Prinzipien von UDP ist, dass angenommen wird, dass die gesendeten Pakete vom Empfänger auch empfangen werden (oder eine entsprechende Steuerung findet auf einer anderen Schicht, beispielsweise einer Anwendung, statt).  
Theoretisch bzw. für bestimmte Protokolle (bei welchen auf keiner anderen Schicht eine Steuerung stattfindet – beispielsweise bei monodirektionalen Übertragungen) wird die Rate, zu der Datenpakete durch den Sender gesendet werden können, nicht von der Zeit, die zur Auslieferung an den Empfänger benötigt wird (=Latenz), beeinflusst., Der Sender wird unabhängig von dieser eine definierte Anzahl an Datenpaketen pro Sekunde senden, die wiederum von anderen Faktoren abhängt (Anwendung, Betriebssystem, Ressourcen, …).

Warum wird TCP direkt von der Latenz beeinflusst:

  • TCP dagegen ist ein komplexeres Protokoll, da es einen Mechanismen integriert, der prüft, ob sämtliche Datenpakete auch korrekt geliefert werden. Dieser Mechanismus wird Bestätigung (engl. acknowledgement) genannt: Er veranlasst den Empfänger, an den Sender ein spezifisches Paket oder Flag (ACK-Paket bzw. ACK-Flag) zu senden, das den korrekten Empfang des Datenpakets bestätigt. Der Effizienz wegen werden nicht alle Datenpakete einzeln bestätigt: Der Sender wartet entsprechend nicht auf eine Bestätigung nach jedem einzelnen Paket, um die nächsten Datenpakete zu senden. Tatsächlich wird die Anzahl der Datenpakete, die gesendet werden können, bevor ein korrespondierendes Bestätigungspaket erhalten werden muss, von einem Wert, der als TCP Sendefenster (engl. TCP Congestion Window) bezeichnet wird, gesteuert.
Round trip latency TCP Throughput
0ms 93.5 Mbps
30ms 16.2 Mbps
60ms 8.07 Mbps
90ms 5.32 Mbps

Nehmen wir hypothetisch an, dass kein Paket verloren geht:

  • Der Sender wird ein erstes Kontingent an Datenpaketen gleichzeitig senden (entsprechend dem TCP Congestion Window). Erhält der Sender das Bestätigungspaket, wird das TCP Congestion Window vergrößert. Sukzessiv wird also die Anzahl an Paketen, die in einem bestimmten Zeitraum gleichzeitig gesendet werden können, steigen (Durchsatzrate). Die Verzögerung, mit welcher die Bestätigungspakete empfangen werden (=Latenz), hat einen Einfluss darauf, wie schnell das TCP Congestion Window vergrößert wird (entsprechend auch auf die Durchsatzrate). 
    Ist die Latenz hoch, bedeutet dies, dass der Sender länger untätig ist (keine neuen Pakete sendet), was wiederum die Geschwindigkeit, mit welcher die Durchsatzrate steigt, reduziert. 
    Die Testwerte (Quelle: http://smutz.us/techtips/NetworkLatency.html) sind sehr deutlich: Warum wird TCP durch wiederholte Paketsendungen (Retransmissions) und Datenverlust beeinflusst?

Der TCP Congestion Window Mechanismus geht folgendermaßen mit fehlenden Bestätigungspaketen um:

  • Bleibt das Bestätigungspaket nach einer fest definierten Zeit (Timer) aus, wird das Paket als verloren eingestuft und das TCP Congestion Window, also die Anzahl der gleichzeitig gesendeten Pakete, wird halbiert (die Durchsatzrate entsprechend auch – dies korrespondiert mit der Wahrnehmung einer restringierten Kapazität irgendwo auf dem Verbindungsweg seitens des Senders); die Größe des TCP Windows kann wieder ansteigen, wenn die Bestätigungspakete korrekt empfangen werden.

Datenverlust hat zwei Effekte auf die Geschwindigkeit der Datenübertragung:

  • Die Pakete müssen erneut gesendet werden (selbst wenn lediglich das Bestätigungspaket verloren gegangen ist, die Datenpakete aber empfangen wurden) und das TCP Congestion Window wird keine optimale Durchsatzrate zulassen: Dies gilt unabhängig vom Grund für den Verlust der Bestätigungspakete (Überlastung, Serverprobleme, Art der Paketschnürung, …) Ich hoffe, dies hilft Ihnen dabei, die Auswirkungen von Retransmissions/Datenverlusten auf die Effektivität Ihrer TCP-Anwendungen zu verstehen.

With 2% packetloss, the TCP throughput is between 6 and 25 lower than with no packet loss.

Round trip latency TCP Throughput with no packet loss TCP Throughput with 2% packet loss
0 ms 93.5 Mbps 3.72 Mbps
30 ms 16.2 Mbps 1.63 Mbps
60 ms 8.7 Mbps 1.33 Mbps
90 ms 5.32 Mbps 0.85 Mbps

Data theft can affect anyone

Data loss or theft can be a worrying experience for any business. As major retailers, including Home Depot, Staples and Kmart, as well as banks and healthcare organisations have already experienced in the past year, cyberattacks can occur at any time and come from any source.

Unfortunately, you can’t have it all in the modern world, because it’s impossible to automate your data and stay competitive if you insulate yourself from digital technology. Data collection is simply a part of today’s way of life that we all have to accept, but still, businesses increasingly need to guarantee a high level of security and protect the privacy of individuals.

Fortunately, data theft can sometimes be avoided or simply kept to a minimum. The following is a list of things that companies can do to avoid data theft:

  • Limit data sharing with third parties
  • Encrypt online payment pages
  • Ignore suspicious or unknown emails
  • Limit the number of sites you share your credit card information with
  • Avoid giving out too much personal information on social media sites
  • Change PINs and passwords frequently
  • Freeze accounts that you suspect may be compromised 
  • Monitor accounts for questionable charges

Once you have adopted these simple guidelines, it is important that you continue to be vigilant against data theft, because hackers resort to all kinds of methods to penetrate corporate databases. To protect your databases as much as possible, you should apply the following five steps when a data theft is suspected:

  • Communication is an important factor after a data theft: inform all employees that a data breach has occurred and that you as a company take responsibility for it. Also be open and clear about why this data theft could happen. Then you should inform the affected users about how they can clear up the impact of a data theft. Finally, have an honest discussion with your staff about the source of the problem in an effort to avoid similar problems in the future.
  • Consult your IT engineers: Forensics is crucial to analyse network traffic and find out why such a data breach occurred. Therefore, be proactive and save all your organisation’s traffic, including all data packets, for later analysis. The archived traffic can then be reviewed by security experts to detect anomalies and determine where and when a data breach occurred.
  • Use a proactive security system: Although firewalls can prevent certain types of external attacks, they will do nothing against malware that has infiltrated the organisation’s network. A multi-layered approach that includes a hierarchical search by date, event, IP address and extent of damage is the best way to address security solutions.
  • Review the data that was stolen to determine the extent of the damage: Change all passwords and contact your credit bureaus to inform them that a data theft has occurred so that appropriate action can be taken. Also contact all financial institutions, such as banks and credit card companies, immediately to prevent unauthorised transactions.
  • Finally, most countries have passed laws dealing with data breaches, which include, for example, that a person who has been a victim of data theft must be notified immediately. Make sure your employees have also signed a confidentiality and non-disclosure agreement to avoid further liability should an employee be responsible for the data theft. In addition, having a privacy policy in place will be the first step in protecting data in the future.
  • While corporate data theft increases in number and severity, access to the original data packets is critical to quickly identify the source and extent of security incidents on the network. With its unique ability to capture and store critical network traffic from hundreds of alerts per day, Savvius Vigil 2.0 is the only solution to provide network traceability in the event of a data theft that occurred so far in the past that the network traffic that occurred is no longer available with traditional solutions.

Network Analysis – Packet Capturing

Network packet analysis is a great method for diagnosing network problems. The data in the network or on the affected devices is recorded and examined with special analysis devices. This technique gives you a deep insight into the data packets and allows you to identify and correct errors very precisely.

Network analysis by means of “capturing” procedures is one of the most reliable analysis methods, as you receive unaltered information from the corresponding network connections to your network, server, client and application and can evaluate this data without loss and without interference. The data to be analysed is passed on completely and transparently from so-called Network TAPs to the analyser while maintaining data integrity.

symbol photo - fisherman-in-server-room

Measuring point - Single or Multiple?

A SPAN port is often used as a measuring point, as it requires the least installation effort to access the relevant network data. The better measuring point is a network TAP.

I have described the advantages of Network (Ethernet) TAPs in my previous article and I assume that you are familiar with them. Certainly, it is possible to investigate the cause of the problem using a single measurement point on the network, but to determine the location of the problem, additional measurement points can be beneficial.

Depending on where you record the data, you get a different picture of the communication. Especially to determine “one-way-delay” or the location of packet loss, it is advisable to consider several measurement points. In addition, the use of several analysis points can significantly increase the quality of the measurement and problem analysis.

In this way, the recorded data can be conveniently compared with each other and latency, one-way delay, packet losses and other important parameters can be determined. Without a doubt, standard errors can also be limited or diagnosed with only one measuring point, but due to increasingly complex network infrastructures, there are significant advantages to multi-point analysis. You determine the capture points yourself and can thus more easily and accurately analyse the transport path of the packets and diagnose the identification of problem areas more quickly. Detecting anomalies and getting your network back on track becomes child’s play.

How does a multi-segment analysis work?

With this method, the network data is examined at several points in the network and compared with each other. However, especially with multi-segment analysis, time synchronisation is immensely important, as the result is strongly influenced and falsified by unclean methods. If I want to measure latency and delays precisely and accurately, then I need hardware with which I can capture the packets with nanosecond precision and provide them with an absolute time.

With special network capture cards that use FPGA to record the data, it is now possible to record data packets with 8ns accuracy. This method is also called time stamping and is supported by all professional analysis and measurement tools. But even without such FPGA cards, it is possible to perform multi-point analyses, namely by correlating the data at an analysis point, e.g. recording with Link Aggregation TAPs, or using OmniPeek Enterprise for analysis.

If the data is aggregated during the capture, it is important to mark the data traffic with a VLAN tag beforehand or to mark the measuring points directly during the capture in order to be able to recognise the origin of the data during the analysis. It is not uncommon to prefer the fast way of capturing data for time reasons and to collect the network data on the affected systems.

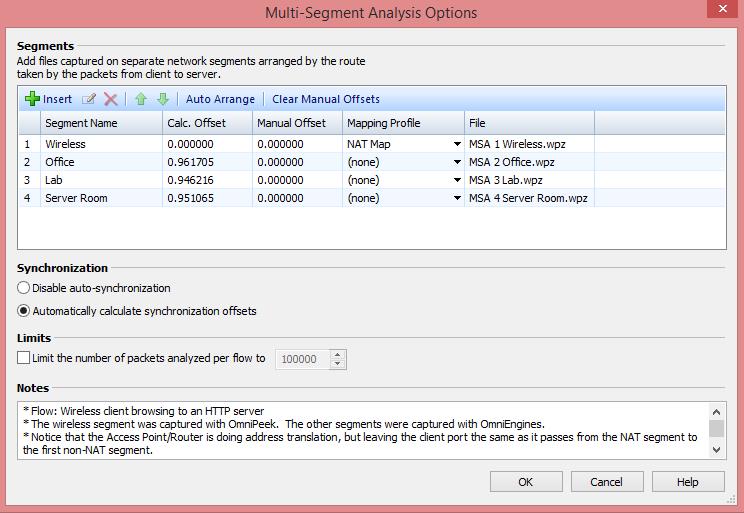
Tools such as TCPDump or Wireshark (PCAP) can be used, or the OmniPeek Remote Assistant can be consulted for help. If the trace data is now available from different systems (TAP, client, server, etc.), a correction of the absolute time is required, as otherwise an analysis is almost impossible. A special function in OmniPeek Enterprise allows you to manually correct the time differences between the different trace files by means of offset adjustments. OmniPeek will gladly take over this task for you and synchronise the time intervals so that you can concentrate on the essentials.

The more measurement points I want to roll out in the network, the more network interfaces are needed on the analysis computer. In our example we assume 4 measuring points. In this setup, the data is available in 4-fold form and must be written away accordingly. If you are only interested in the data of a single application, you can use filters to ignore the unwanted traffic before capturing and reduce the load on the analysis tool.

What is the advantage of multi-segment analysis?

Now it is about increasing the quality of the measurement and gaining valuable information from the network. Ideally, the data should be collected once at the client and once at the server and the other measuring points should be placed in the network, e.g. in the distribution and core area.

This would technically enable us to analyse the data packets and transactions from a certain client to the server in detail and to localise the location of possible errors. Proxies and many other security tools can cause latency or other critical errors due to performance problems, and these must be identified.

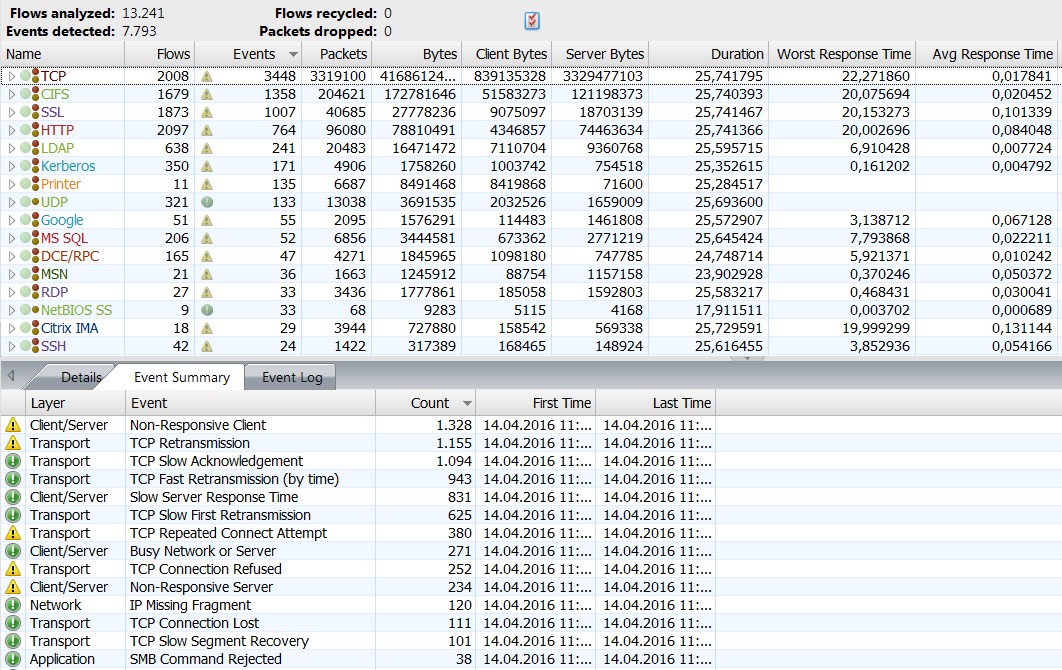
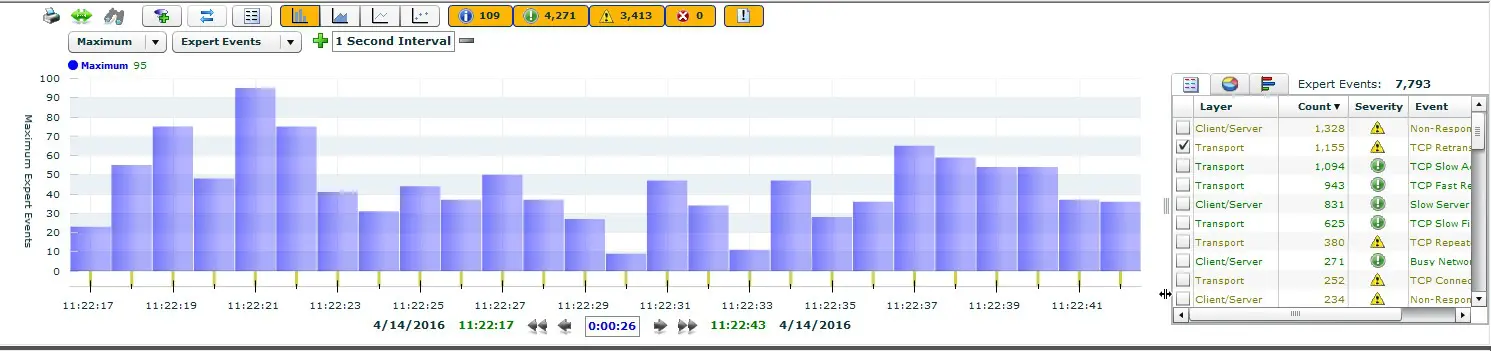
Why do retransmissions occur and what causes them? Where do packet losses occur and what is the cause; is it passive components or are network components to blame? If I have latency or jitter, I want to know where exactly it is occurring. These and many other questions can be answered by means of a multi-segment analysis.

Application of the multi-segment analysis

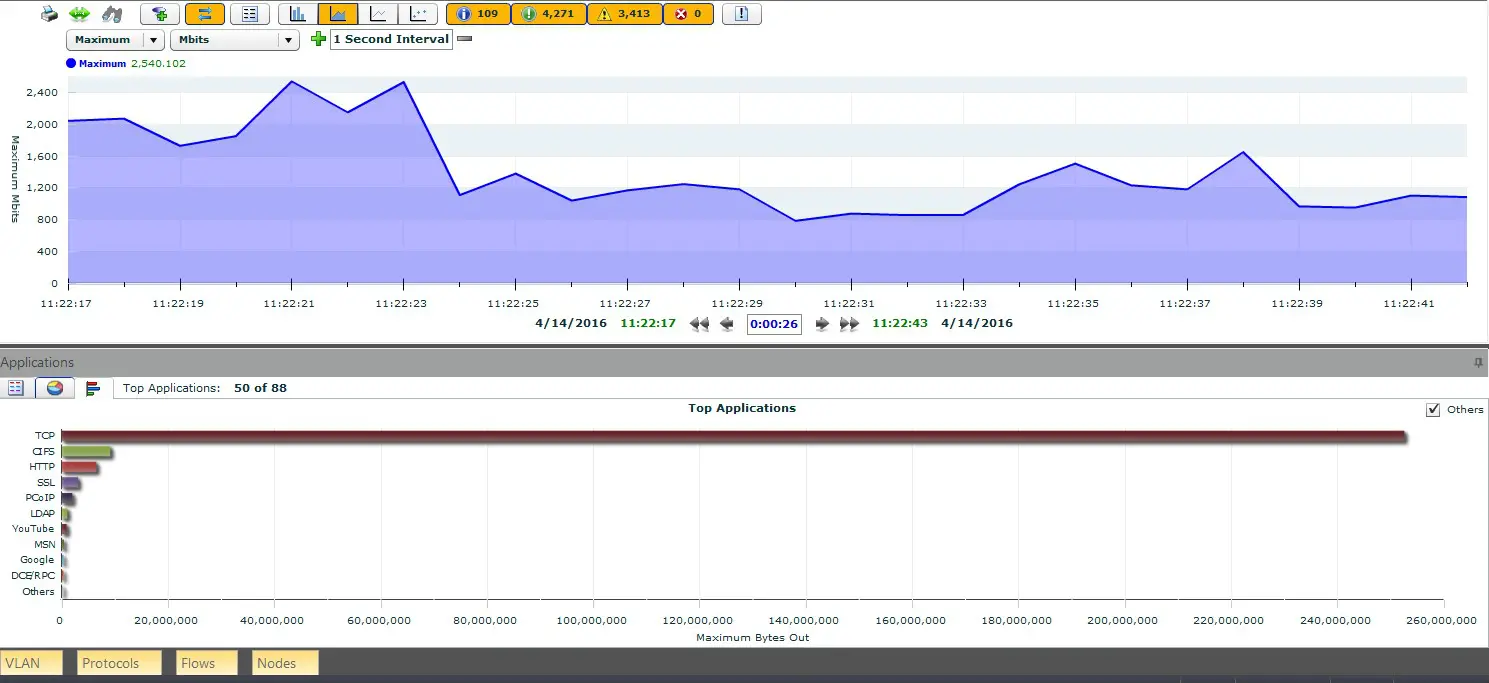
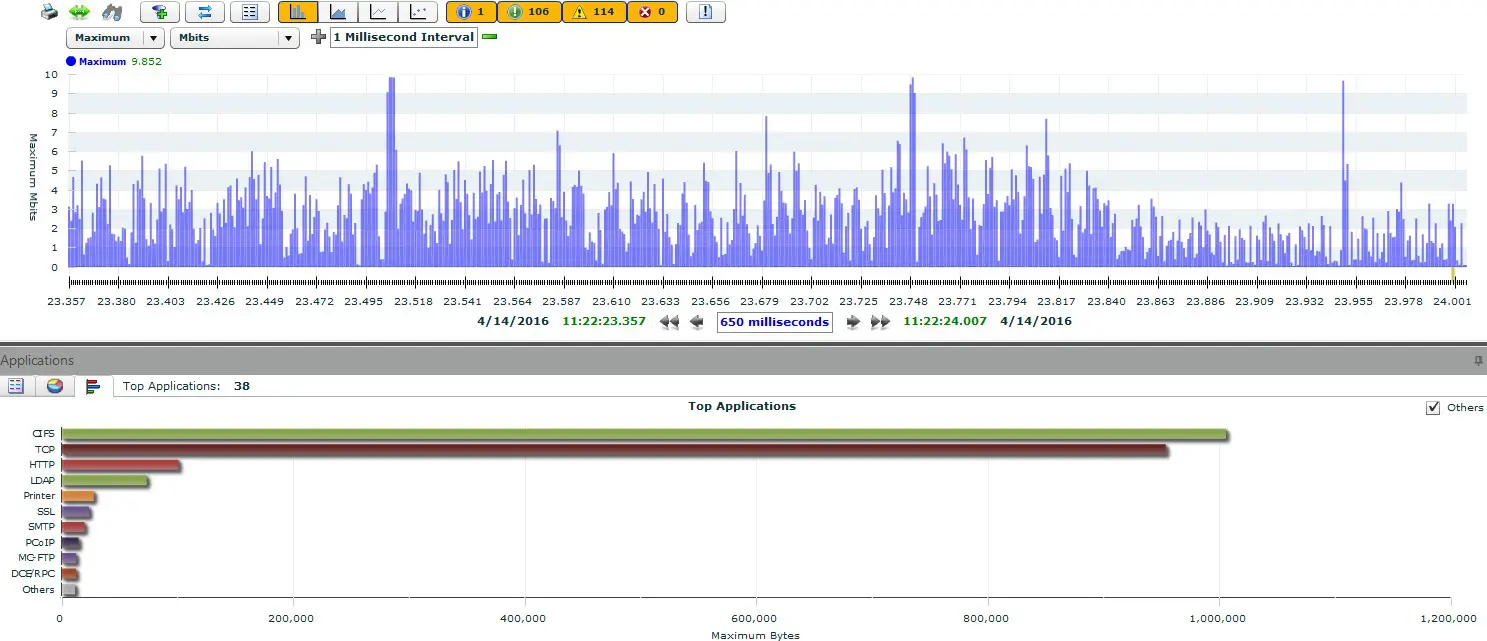
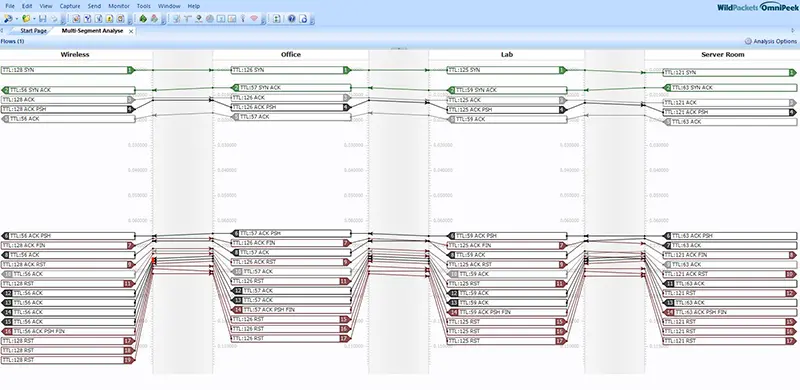
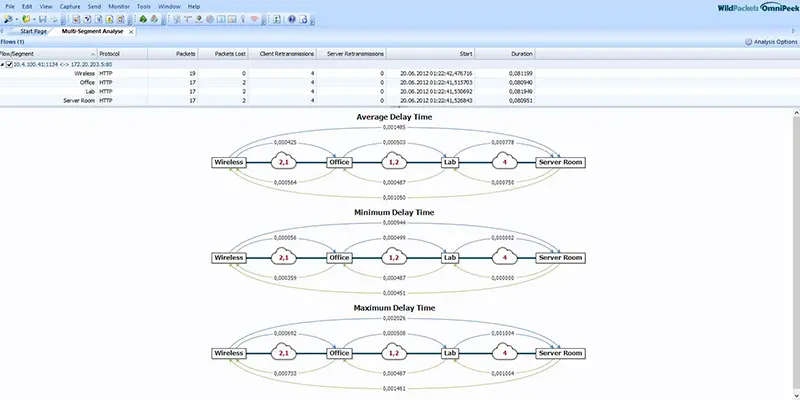
Nowadays, there are analysis tools that allow automated multi-segment analysis and eliminate the need to manually sift through packets. Fortunately, the OmniPeek product supports multi-segment analysis and shows you the paths of the packets graphically, simplifying the analysis of this data. The network data is displayed correlated on one screen together with the packet paths and the individual hops.

You can see the latencies caused and the packet losses that have occurred at a glance, without having to analyse them intensively. The valuable thing about this is that you can immediately see where the latencies and packet losses occur and, above all, in which direction. Furthermore, the routes and hops of network packets can be analysed and the runtimes or the quality or convergence time of HA connections can be measured.

Especially with real-time applications like VoIP, I would like to know where jitter or delay occurs. Especially with VoIP it is not difficult to detect quality problems, but to locate them precisely is usually a difficult challenge for a network administrator. Also the latency or other network errors between the WLAN and the LAN network can be measured and diagnosed with OmniPeek’s multi-segment analysis.

Proactive not reactive

Therefore, it is advantageous for network analyses and troubleshooting tasks to have fixed measuring points in the network, through which one can easily access the network packets if necessary. Furthermore, a proactive analysis is very helpful, as errors often occur and disappear again a short time later.

Especially in the case of sporadically occurring errors, it is very advisable to have fixed measuring points and to record the data for a certain period of time. This makes troubleshooting much easier and allows you to quickly identify errors that occurred in the past. Otherwise, you are in the dark and may not be able to isolate the error because it is no longer present or only occurs during certain events.

Thank you for your upload

Skip to content