LiveAction Professional Network Performance Monitoring and Management
LiveAction simplifies the management of complex enterprise networks with its patented visualization capabilities
LiveAction ensures superior end-user experience and networked application performance by providing comprehensive dashboards, alerts, reports, troubleshooting, and workflows that shorten the time to IT operations solution.
Increase network department efficiency in policy verification, and maintain performance, automate incident management workflow alerts with IT Service Management and provide the network department with current and historical performance visualizations.
SDN and multi-cloud redesign capabilities, path and performance records, and 3-click interruption for troubleshooting in end-to-end multi-domain, multi-cloud, and multi-vendor environments.
What is LiveAction?
Best in Class Multi-Vendor Network Performance Management and Visibility
LiveAction’s flagship product is the LiveNX monitoring platform, which primarily uses SNMP and all types of flow to gather information. These statistics can be extended via API with metrics from third-party management systems such as Cisco (vManage, DNA Center, ISE) ServiceNow, AWS, Microsoft, Fortinet, PaloAlto, etc.
Another module of the LiveNX platform is the LiveWire technology. Here, a copy of the Ethernet traffic is stored loss-free and court-proof for forensic analyses (FiFo principle). At the same time, this is analysed in real time via OSI Layer 2-7 for anomalies and the statistics obtained are sent to LiveNX.
Thus, the health of a network can then be monitored from a central GUI and, if necessary, a drill-down can be started at any time and independently of the location on each individual network interface or also on each individual data packet, depending on whether the source of information is SNMP/flow or packet-based.
The Deep Packet Inspection technology of LiveWire Probes is currently being extended with an intelligent approach for the analysis of encrypted traffic for thread detection. Called Deep Packet Dynamics, it uses machine learning and artificial intelligence to identify threats without the need to decrypt SSL/TLS traffic for security inspection.
LiveAction’s probes and the renowned protocol analyzer Omnipeek can of course also be used independently for network forensics and troubleshooting.
LiveAction’s long-standing customers in D-A-CH include A1 Telekom, Alpla, Atruvia, Continental, DATEV, Deutsche Telekom, Ferrero, Mondi, MTU, Postbank, Roche, VW and many more. The LiveAction team in D-A-CH has over 20 years of experience in the field of network analysis and can therefore deliver all products with a personal fault-finding guarantee.
Products
LiveNX NETWORK PERFORMANCE MANAGEMENT SOLUTION
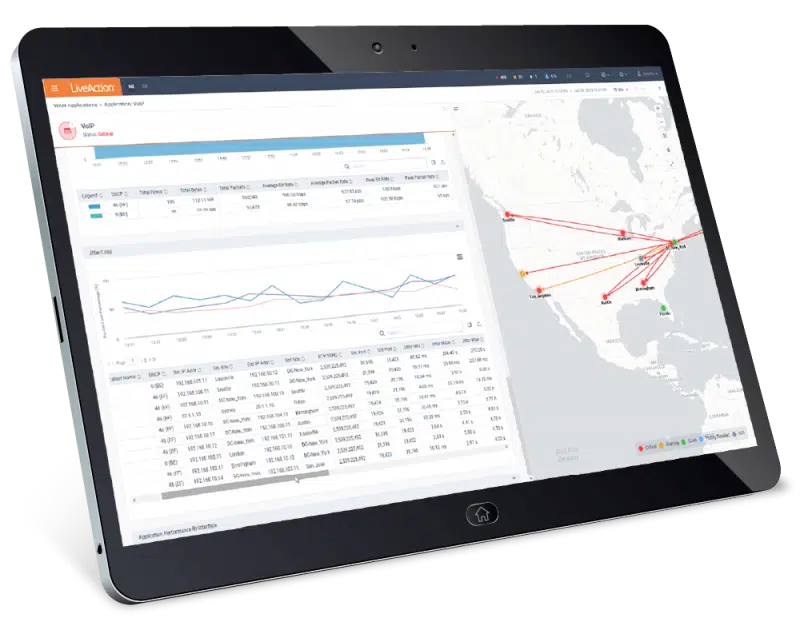
LiveNX is a network and application performance monitoring platform with patented end-to-end visualization for a global view of the network and the ability to drill-down to individual devices.
Multi-vendor – Unified, end-to-end abstracted view of the entire network with vendors such as Cisco, Fortinet, AWS, Google, Azure, etc.
LiveWire PACKET CAPTURE SOLUTION FOR HARDWARE AND SOFTWARE
LiveWire is a high-performance packet capture software that integrates seamlessly with LiveNX to extend network monitoring and application troubleshooting to remote sites and branches, WAN edge, and data centers.
Value Added – 4x performance with less rack space and lower total cost of ownership compared to traditional manufacturers
Performance – 100G line rate support
Insights – Root Cause Analysis
Capacity – Large memory for packet retention
Density – Smaller data centre footprint
Usability – Easy to use for the NOC
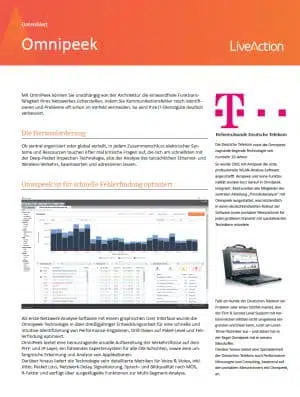
Omnipeek NETWORK PROTOCOL ANALYZER
Quickly identify and resolve network performance bottlenecks anywhere before they happen with our powerful network software analyzer.
Best of its kind for measurements in the Ethernet to 40 Gb/s, Wireless 802.11a/b/g/n/ac and virtual environments.
Simple global analysis of duration, packet loss and retransmissions.
Evaluation both online and offline over long periods.
Flow-based expert analysis of all OSI layers.
Comprehensive metrics for network and application latency, as well as voice and video quality.
Intuitive statistics on communication partners, protocols, and traffic characteristics and their impact on network performance.
Provides both an overview and greater detail with excellent drill-down functions.
Provides auditable and accurate evidence.
Can be integrated with corporate policies (e.g. Privacy & Security).
Scalable to meet individual needs of networks of any size.
Solutions
Network Performance Management
Insights into Applications and End User Experiencer
SD-WAN Monitoring
Planning, Deployment and Operation
QoS Monitoring and Control
Quality of Service Management for Critical Applications
Network Monitoring for Service Providers
Network Service Assurance for Service Providers
Network Data Analytics
Smarter Machines Improve Performance
Endpoint Monitoring
Insight Into User Behavior and Impact on the Network
Diagnostics
Accelerate troubleshooting with real-time visibility
Service Assurance
Digital Experiences Rely on Network Service Assurance
Next-Gen NPMD
Delivering the Next Generation of Network Performance Monitoring and Diagnostics
Applications increase organisational productivity, but seeing the details is hardly possible
More and more businesses are relying on SaaS and other cloud-based applications to keep the business running, but it’s difficult to see all network activity, including applications and endpoints. A single platform can help you manage your organisation’s network performance holistically.
Improve user experience
Break down from an enterprise-wide topology map to a specific interface and application traffic to contextually see, analyse and proactively manage the parameters that impact your user experience.
Simplification of IT operations
LiveNX provides a single, unified view of your entire network environment to better manage performance, dashboard and report on service-level metrics, promote business collaboration and reduce operational costs by eliminating wasted resources.
Shorter time to resolution
Close incidents on the first call and avoid escalations. Bandwidth-intensive services such as Voice over IP, Unified Communications and multimedia websites require end-to-end capabilities to quickly identify and resolve problems. LiveNX provides full visibility of QoS policies and data path configurations with insights into network devices and interface parameters so that performance issues such as jitter and packet loss are quickly identified and resolved.
Automated dashboards and reports
Little or no insight into end-to-end application behaviour leaves your organisation vulnerable to lost productivity and disappointed customers. When network and IT operations don’t have the insight to know if the application or network is affecting the experience, it leads to finger-pointing and a longer time to resolve the incident.
LiveNX provides unified SD-WAN performance management at every stage of planning, verification and operations
Nutzen Sie die LiveNX-Platform to simplify operational complexity with rich visual analytics for advanced SD-WAN reporting and troubleshooting to ensure continuous monitoring and control of your network environment.
Actionable insights about your Cisco SD-WAN portfolio
LiveAction is a trusted Cisco Solution Partner with deep insights into Cisco Viptela, Meraki and IWAN architectures. LiveNX aggregates telemetry and API data and delivers continuous performance visibility across applications, tunnel overlay, sites, devices and service provider transport to provide a complete view of your SD-WAN environment.
PLANNING: SD-WAN Baseline and Benchmarking
Moving from a local router architecture to a cloud-based control architecture requires planning. Get informed before you start working with LiveNX. With LiveNX, it all starts with benchmarking performance parameters for end users, applications, networks and multi-cloud services for input into policy design and SLA parameters.
Software-defined is eating the WAN
VERIFY: SD-WAN Application Performance Management
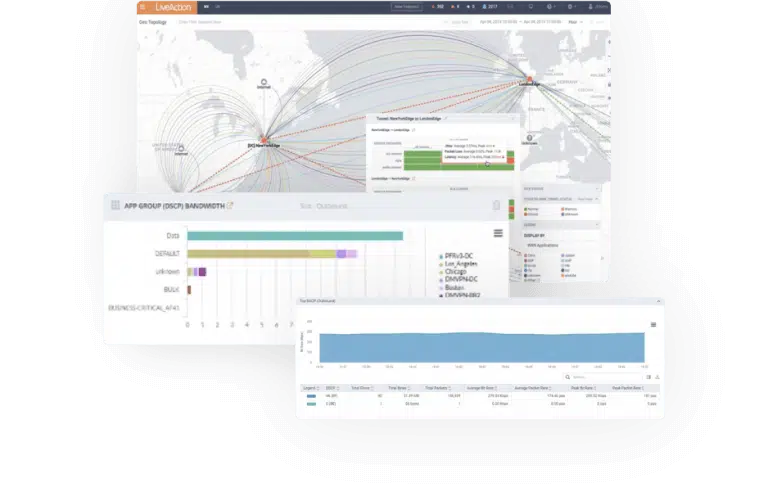
LiveNX provides full visualisation of SD-WAN policies for: Applications, VPN, DSCP and Service Provider tunnels to review and monitor end-to-end service performance.
Transport flexibility is a core principle of SD-WAN. LiveNX Geo’s topology view provides network engineering with tunnel overlay connectivity maps for quick policy design verification to know it is working as expected.
With application bandwidth consumption, QoS tagging and policy verification, Operations now has the reporting data it needs to troubleshoot SD-WAN, quickly isolate problems and find the root cause for faster MTTR.
Site To Site Analysis
OPERATION: Extensive visual analysis to quickly check, detect and isolate problems
LiveNX provides complete visualisation of SD-WAN application policies, tunnel overlays, traffic paths and end-to-end service performance. With dashboards, alerts, reports and rapid troubleshooting, application performance is continuously monitored to ensure the end-user experience is a positive one.
LiveNX in action
Deep insights and reports on application behaviour for smooth operation
Monitor and continuously assess application performance characteristics across the network. LiveNX’s real-time network topology maps enable network operations teams to monitor and report on pre- and post-environment traffic, performance and bandwidth of applications.
Future-proof Your SD-WAN Investment
Integrate Cisco SD-WAN (Meraki) into your business while LiveNX supports you. With value-added performance monitoring for network and application visibility, LiveNX provides service provider capacity utilisation, site-to-site traffic types, class of service and application delays, and more. LiveNX provides end-to-end service assurance for your WiFi environments across your enterprise.
Cisco SD-WAN (Merakai) Integration with LiveNX – Use Cases
Quickly finding the root cause of complex voice, video and application problems is a challenge, which can be almost impossible to fix
As new voice, video and critical applications are added to the network, the challenge of configuring highly complex QoS policies across multiple devices to support these applications can become daunting. Using CLI to deploy a policy before a new service rollout can be time-consuming and error-prone.
Manage QoS to improve network efficiency
View, analyse and control service-impacting QoS configurations and policies to proactively deliver service assurance across your organisation every day.
Recognise the impact on voice, video and critical applications
Understand QoS performance for individual interfaces, applications and classes to determine the size, scope and nature of the impact of policies on critical applications. Proactive monitoring of critical quality of service allows you to resolve issues before they are reported by end users.
Implement QoS policies quickly and accurately
Reduce configuration errors with easy-to-use, rule-based QoS policies and templates. The ability to automatically save, backup and deploy scheduled configuration changes means policies are consistent and accurate across the network. Use real-time performance reporting when implementing policies to quickly identify and immediately resolve errors.
Faster implementation of policy changes in an intuitive graphical user interface
A graphical user interface replaces the output of command line information with real-time graphics and an easy-to-understand policy viewer. QoS policy reports provide more detailed information about configuration settings, performance issues, crashes and policy errors.
Knowing end-user activity is challenging - even on a good day
Most endpoint network management tools provide incomplete performance data limited to single points in time, leaving gaps for IT teams while exposing organisations to unacceptable risks and unnecessary costs.
Continuous endpoint visibility and control
Continuous data collection from every managed endpoint across mobile, cloud, virtual machines, laptops and IoT devices gives you greater insight into systems, user behaviour, network connectivity, application, binary and process data.
Eliminate unmanaged IT resources
LiveNX, together with LiveAgent, provides full visibility and continuous discovery of all connected devices – physical and virtual – including on the network, off the network, in the data centre, and in the cloud.
By providing continuous, passive discovery, LiveAgent avoids point-in-time, active scanning that rarely misses connecting assets and risks triggering security tool alerts. LiveAgent provides comprehensive data and captures every device, including IP address, hostname, MAC address, device manufacturer and device type.
Proactive management of systems
Improve helpdesk operations and average repair time with LiveAgent’s device monitoring, proactive system analysis, and troubleshooting and repair capabilities.
LiveAgent enables IT asset discovery and inventory, software detection, foreground and background usage tracking, and ongoing licence simplification.
Continuous monitoring of device health supports risk management through ongoing policy review and enforcement, vulnerability assessments and patch installations.
Continuous monitoring, alerting and action
Monitor and continuously assess application performance characteristics across the network. LiveNX real-time network topology maps enable network operations teams to view and document traffic, performance and bandwidth of top applications.
When users complain about a slow network, we all know that it is often not the network, but network engineers need to be able to verify both the network and the application used to determine the root cause.
Measuring network latency versus application latency is the proof the network engineer needs. Latency monitoring can help determine if problems are limited to a specific user or server or are more global, but simple latency monitoring lacks the detail needed to correlate areas of latency with other relevant statistics, including other network traffic occurring at that time.
Questions arise such as:
Is the network slowdown due to my network or applications?
How do I establish a baseline for application and network usage?
How much of my network bandwidth is being used by my critical applications?
Solution
Use LiveWire and Omnipeek, or LiveCapture and Omnipeek to capture packets in the appropriate network segment.
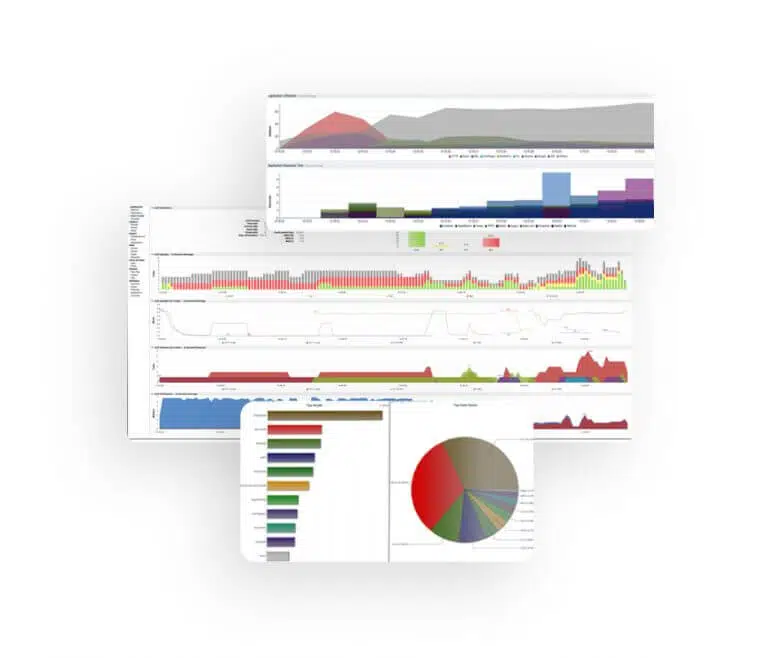
This way you can view network and application latency across multiple segments, determine excessive bandwidth consumers and monitor network utilisation. With Spotlight, you can instantly see the worst-performing flows on your network and, if necessary, look into the packets associated with those flows.
Visual analytics provide situational awareness for managing a safe digital experience
Little or no visibility into end-to-end application behaviour across the network leaves your organisation vulnerable to lost productivity and disappointed customers due to poor application service. Network and IT departments lack the insight to know if the application or network is impacting the user experience, leading to user finger pointing and a longer time to resolve the incident.
End-to-end network transparency
Pervasive network visibility provides insights to ensure smooth business operations and achieve service level agreements. Optimise the user experience with in-service insights, proactive anomaly detection, performance dashboards and reporting to meet quality and governance standards.
Better digital experience means satisfied customers and productive employees
Every business relies on offering or delivering amazing digital experiences. This requires reliable networks that consistently exceed user expectations. With service assurance, businesses know that network policies, configurations and traffic management are helping to keep their businesses operating at optimal performance.
Business owners rely on IT, to get to the solution faster
Enable your network engineering and operations teams to make good decisions. The LiveNX performance and analytics platform provides the ability to view, analyse and control relevant network policies and parameters. This gives network engineers and operations teams the confidence that network services maintain availability and meet the critical business needs of modern digital enterprises.
Detect, isolate and block intruders
Security engineers are proactively alerted to abnormal behaviour. Through Multiple Data Set (MDS) analysis, LiveNX real-time path maps, app groups and tunnel analysis across the WAN, data centre and campus fabrics provide the ability to detect, isolate and block malicious data.
Achieve the Visiblity Necessary to Protect Your Network
Consistent Quality of Service
Class of Service defines how your traffic is handled by each network device. With LiveNX, network engineers and IT administrators have precise control over QoS policies, configurations and queue handling at each site, device and interface. This is comprehensive quality of service control at your fingertips.
Next Generation Network Performance Monitoring and Diagnostics
Flow gives you...
… a comprehensive understanding of network performance and application impact, especially when integrated with control data accessed via SNMP and APIs.
Packages give you...
… a look at your network that only line data can provide, and the ability to diagnose problems with precision and efficiency that otherwise would not be possible.
Taken together...
… makes your entire network visible with end-to-end monitoring, comprehensive analysis and deep diagnostics, from the WAN edge to the data center core.
If you know LiveNX...
… then you know LiveAction has the industry’s most advanced visualization engine, aggregating flow, SNMP, and API-based data for unprecedented visibility and control.
If you know LiveCapture and Omnipeek...
… then you know that LiveCapture is the fastest and most powerful network traffic analytical acquisition application that sends data to Omnipeek, the industry’s most advanced protocol analysis software.
VIDEO Mean time to innocence (1:09 min)
Datasheet- LiveNX
Datasheet- LiveWire
Datasheet- Omnipeek
Brochure - LiveCapture Portable
We will be happy to consult you and look forward to hearing from you!