The Extrahop Visibility Platform for Uncompromising Performance Analysis
As organizations scale to support a seamless digital experience despite unprecedented complexity, IT must identify network and application issues, diagnose them, and take action faster than ever before. The ExtraHop Performance Platform gives you comprehensive visibility on all OSI layer levels and helps you to uncover the cause of performance problems in a matter of seconds, thus reducing application downtime enormously.
With an analytics first workflow based on machine learning and robust integrations for investigation automation, ExtraHop Performance helps you deliver a best-in-class customer experience from the core to the edge to the cloud.
ExtraHop Performance provides real-time visibility into everything from database to cloud traffic through reliable decoding and decryption of over 50 enterprise protocols, including SSL/TLS-encrypted sessions, at 100 Gbps line rate. With the help of stream processing, ExtraHop converts your network data into structured line data in real time, while machine learning additionally helps you uncover and respond to hidden problems and opportunities without compromising your application performance.
- Automatic detection and classification of all network devices from the data center to the cloud.
- Recognize performancenomalities with machine learning trained on 4600+ line data metrics.
- Move from contextualized insights to forensic evidence in seconds.
Rise Above the Competition
Real-time Visibility
With a dynamic real-time view of all transactions in your environment, any team from NetOps to SecOps can quickly identify and resolve problems.
Line-Rate Decryption
ExtraHop decrypts SSL/TLS (including TLS 1.3) in real time so you can ensure both security compliance and complete visibility into troubleshooting.
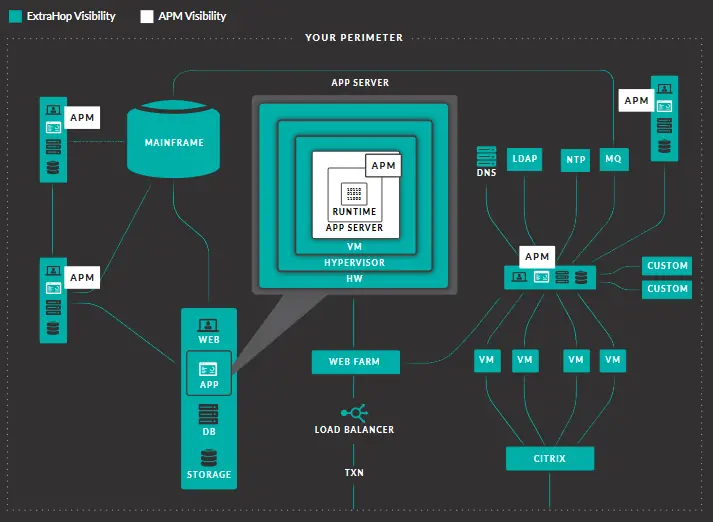
Everything at a Glance
From a high-level map of all assets in your organization to specific package payloads for incident resolution, ExtraHop provides context and precision in a single central user interface.
Advanced Machine Learning
Machine Learning, which is based on the most objective, complete data source, provides high fidelity analysis that reduces the mass of false alarms.
Predictive Anomaly Detection
ExtraHop learns how a device should behave based on empirical, observed activity, and then shows unusual behavior in the full context of what will be affected and why.
Automation of Investigations
Integration with other analysis tools and orchestration platforms to automate response processes and easily scale limited resources.
Stream Processing
The backbone of Extrahop’s technology is the real-time stream processor, which converts unstructured network packets at up to 100 Gbps into ordered line data. Designed for parallel processing, the Stream Processor distributes processing tasks across multiple cores – and scales as new generations of server processors are expanded with more cores – giving you deeper insight at a fraction of the cost per Gbit/s analysis compared to other real-time analysis platforms.
Once the real-time stream processor receives a copy of the network traffic, ideally from a network tap, packet broker, or mirror port, it continues under the hood:
1. Decryption with Line Speed
The stream processor decrypts SSL/TLS-encrypted traffic, including encryption suites such as Perfect Forward Secrecy (PFS), at line speed with native hardware acceleration. This bulk decryption can scale up to 64,000 SSL-TPS with 2048-bit keys that no other real-time analysis can achieve in a single unified appliance. Read this quick technical guide for details on Extrahop’s decryption method.
2. Powerful TCP State Machines
Starting from the most basic level, the stream processor creates the TCP state machines for each sender and receiver communicating on the network. As a prerequisite for deeper application protocol and universal payload analysis, this allows the platform to understand all TCP mechanisms and their effects. Since TCP is the meeting point of network and application, this approach helps you to clearly identify whether problems are a network or application problem from the start.
3. Line Protocol Decoding and Fullstream Reassembly
The real-time stream processor decodes IP-based protocols to understand, define, and implement the unique application boundaries of this protocol. This enables the processor to create complete operations, sessions and transactions for a fluid application, which in turn enables higher order content analysis through a complete recombination into line data (derived from the line network itself).
While in a perfect world all of this would run pretty smoothly from start to finish, traffic patterns such as microbursts can actually lead to packet loss through a switch or SPAN; in these cases, the processor is automatically resynchronized and restored.
4. Complete Content Analysis
After compiling packets into full streams, the stream processor analyzes the payload and content of layers 2-7 and automatically detects and classifies all devices or clients communicating on the network. The processor also continuously maps the relationships between all clients, applications and infrastructure communicating on the network, measuring and recording over 4,700 metrics.
Full Content Analysis supports dozens of protocols and provides key indicators such as database methods used and their processing time, user file access, memory access time and error, DNS response time and error, Web URI processing time and status codes, SSL Certificates with expiration date, and load balancer and firewall latency. The stream processor also collects sophisticated network metrics such as window size, retransmission timeouts, and nagle delays.
We find that not everyone is interested in knowing every detail about every level of their environment, but don’t worry – while you always have the full analysis capabilities at your fingertips, it’s also easy to customize your view of the data so you only see the exact metrics and insights you need.
5. Fully Programmable Insights
Once the stream processor has done its job and started delivering line data metrics, it’s time to take control of what you see and in what depth.
ExtraHop uses an event-driven programmable interface called Application Inspection Triggers to connect you to the stream processor and all stream transactions. Triggers allow you to programmatically extract line data events and correlated metrics that are specific to your business, infrastructure, network, clients and applications.
With Application Inspection Triggers, you can be as surgical or verbose as you want, and extract almost anything from a header to full application payload. For HTTP payloads, for example, this data can include sales, order IDs, unique user IDs in cookies or URIs, and even web page titles or error descriptions embedded by a developer in a 500 status code. And it doesn’t matter what HTTP goes through – it could be SOAP/XML, REST, JSON, AJAX, JavaScript or HTML5.
The same principle and functionality applies to all Extrahop natively decoded protocols. You can also use triggers to extract, measure and visualize data from defined fields or to decode proprietary protocols based on TCP and UDP.
Machine Learning
The cloud-based Machine Learning Service tracks detections in eight categories in your environment:
- Authentication, authorization and access control
- network file system
- network infrastructure
- database
- email server
- web server
- Remote access server and method
- Internet communication and telephony
Within each of these categories, Machine Learning evaluates multiple protocols and hundreds of ExtraHop metrics, all with user-defined logic, to find and correlate active problems.
Architecture Overview
Unlike typical SaaS solutions, Extrahop’s Machine Learning Service only transfers de-identified metadata into the cloud. This means that no payloads, file names, strings, or other categories of data that could contain sensitive data leave your organization. ExtraHop has received SOC 2, Type 1 Conformity Certification for its Machine Learning Technology, which you can read more about here.
ExtraHop uses the following combination of local technology and cloud services to support the entire machine learning process:
- An on-site device, fully controlled by you, analyzes network traffic to extract and store more than 4,700 metrics, including IP addresses, URIs, database queries, CIFS file names, VoIP phone numbers, and other potentially sensitive data; you can configure this device to collect custom metrics according to your needs.
- When the Machine Learning service is enabled, a subset of these on-premise metrics are de-identified and sent to a custom cloud computing instance in Amazon Web Services operated by ExtraHop.
- ExtraHop Machine Learning then creates predictive models for the behavior of devices and applications and detects significant deviations from these predictions as anomalies.
- Anomaly events are sent back to your local device, but you can also choose to receive e-mail notifications (which do not contain sensitive data). Once events are back in your environment, you can use your private key to reidentify and decrypt them for alerts and investigations.
Performance Detection
On the performance side, Extrahop detects problems such as VoIP quality problems associated with increased latency and errors, or system startup and logon delays associated with DHCP server errors.

DOCUMENTS
Datasheet
Product Overview

Datasheet
App Analytics Platform

Datasheet
Ref Architecture Guide

Datasheet
Workflow

Datasheet
Extrahop & GDPR

Datasheet
ServiceNow

Datasheet
Protocol Modules

Data Indexing and Storage
ExtraHop uses three complementary formats to index and store your line data:
1. correlated cross-tier metrics in the streaming data store
The streaming datastore, optimized for time-sequenced telemetry, enables user-definable dashboards that can be filled with more than 4,700 possible metrics in real time. This allows you to easily view all communications in your entire environment or focus on specific data sets.
Since the metrics are indexed in the data store, newly discovered devices are automatically classified based on heuristic analysis of machine information and behavior, and ExtraHop begins building baselines for all systems, applications, and networks.
You can use your existing NAS infrastructure to expand the streaming data repository for long-term visibility, which is useful for capacity planning, demonstrating compliance efforts or continuous improvement, and analyzing business activity over time. By default, your data memory stores fast (30 seconds), medium (5 minutes) and slow (1 hour) key figures locally. However, you can store 5-minute, 1-hour and 24-hour key figures externally.
The data store also allows you to create alerts based on current or past behavior and events such as unusual payload size or expiring SSL Certificates.
2. Transaction, Message and Flow Logs
ExtraHop allows you to perform a multidimensional analysis of your line data, even if you do not know any query languages. Think of this as the search capabilities you would find in a log analytics platform, except that you search and analyze line data – a much richer, more consistent, and more reliable source of information than machine logs can provide.
There are two basic types of records in the ExtraHop user interface: flow and transaction. Flow Records show the communication between two devices on the network layer over an (L3) IP protocol, while L7 Records show details of individual messages or transactions over one of the three supported L7 protocols (transaction-based, message-based, and session-based). ExtraHop allows you to search and filter only for L7 traffic or query both Flow and L7 entries.
How ExtraHop collects and stores built-in records and more details about record types and formats can be found in ExtraHop’s documentation.
Your transaction, message, and flow records are all stored in a robust cluster based on scalable Elasticsearch technology, so you can easily add nodes as your data grows.
3. Packages for the Entire Payload
You can either start with individual metrics, users, devices, or packages associated with a particular transaction, or simply access that information from a parent view. ExtraHop delivers packages that offer the full payload, which you can download and further analyze as needed.
ExtraHop provides an advanced forensic review at a much lower price than any other real-time analytics platform, considering that you can add up to 1920TB of extended storage units per deployment to Extrahop with no data charges.
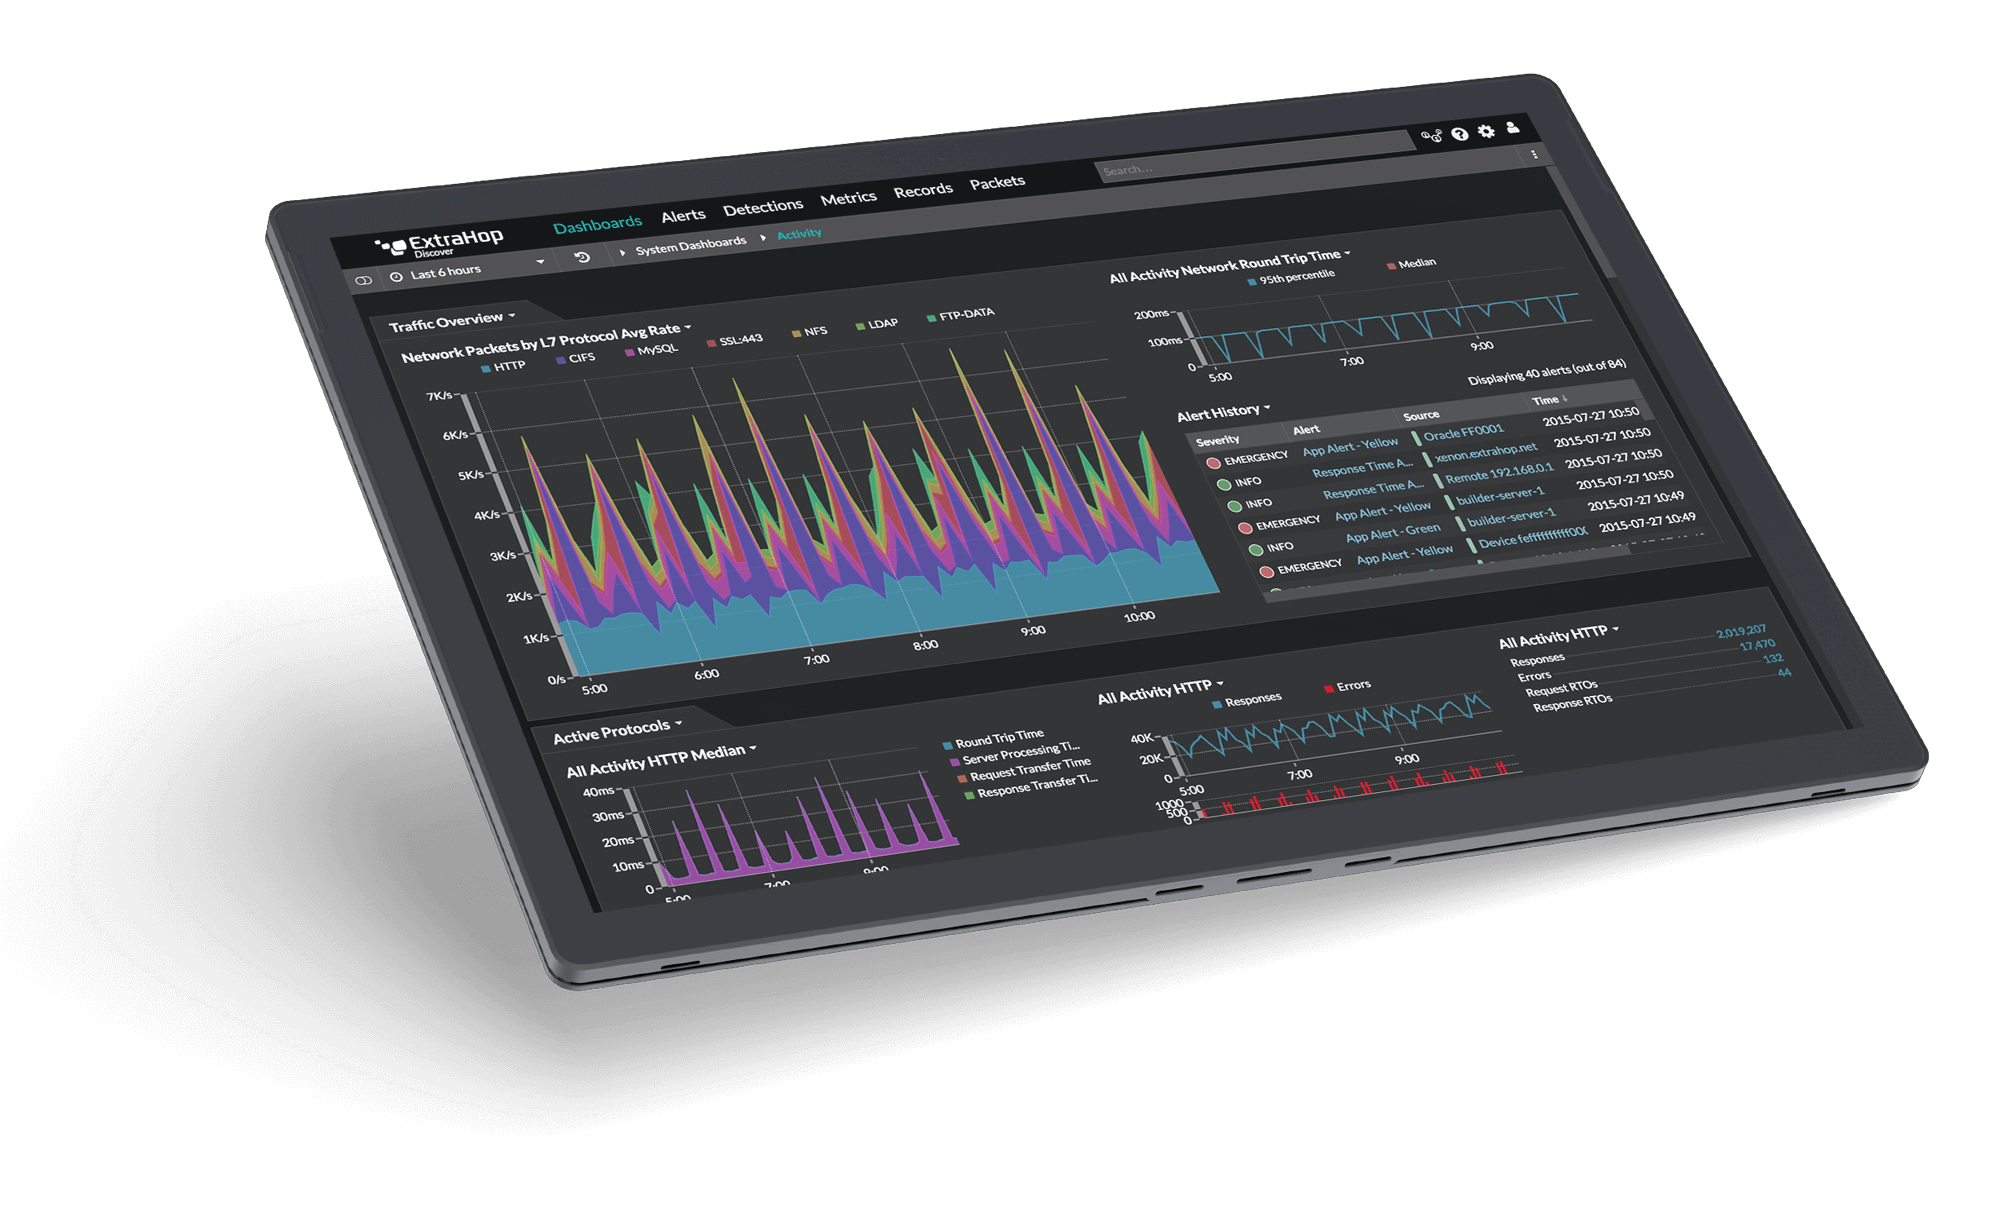
Data Visualization and Exploration
One of the most demanding aspects of real-time analytics in business is, well, the size itself. ExtraHop does its best to make it as easy as possible for you as a user to analyze the immense wealth of information and gain meaningful insights, no matter from which perspective you come.
We start with a simple, intuitive user interface that automatically includes completed role-based dashboards for teams in your organization. These dashboards work on a drag-and-drop model, so you can further customize them with unique widgets; if you want to create your own widget, all you have to do is select the desired data source and metrics, select a visualization type, and save it to your dashboard of choice. Export charts and background data points quickly and easily to PDF, Excel or CSV.
No Scripting? No Problem.
Extrahop’s visual search language gives you the ability to refine or change your search queries by clicking interface elements that control everything from grouping to filtering to time domain selection. Whether you adhere to the hundreds of built-in record attributes or define your own, this functionality means that any user can quickly respond to performance and security questions without having to learn a query language.
For example, if you experience poor audio quality compared to VoIP, you can search VoIP traffic for accelerated forwarding tags and quickly determine which packets might lag behind less time-sensitive traffic due to an incorrectly configured tag.
Live Activity Maps
In addition to traditional methods of data visualization such as charts and graphs, ExtraHop uses live activity maps to provide a dynamic and intuitive view of your environment. Instead of manually creating and updating network diagrams when your IT environment changes, you can use live activity maps to visualize protocol-based connections between devices and applications in real time.
By allowing you to filter by time intervals and expand or limit your scope as needed, Activity Cards make it easier to answer multipart questions such as “How do devices interact within a given level and how have these devices interacted across the network in the last hour”? Anomalous behavioral detections also appear on live activity maps, so you can see the context of the detection before you click into the transaction or even into the exact packages directly from the map.
This blog post goes into much more detail about the latest features of live activity maps and offers some more ideas on how you can use them in your everyday life.
Open Data Stream
While extensive query and research workflows are provided within the ExtraHop interface, Extrahop also makes it easy for you to integrate line data metrics with the other data stores, query tools and analysis platforms in your stack. Open Data Stream allows you to merge data from multiple sources into a single, comprehensive set that can be queried and visualized using the tools your team prefers.
Visit the Extrahop Technology Partners page to learn more about specific integrations such as Extrahop’s partnerships with AppDynamics, the FireEye Threat Analytics Platform, Elastic, MongoDB and many more.
Protocols Decoded by Extrahop
ExtraHop decodes the following enterprise protocols in real time at the application level. Protocol modules provide different levels of analysis, starting with L7 classification, and application inspection triggers can be used to create a custom metric.
AAA: RADIUS*
AAA: DIAMETER*
CIFS*
Citrix ICA*
DHCP
DNS
Database: DB2*
Database: Informix*
Database: Microsoft SQL*
Database: MongoDB*
Database: MySQL
Database: Oracle*
Database: Postgres
Database: Sybase*
Database: Sybase IQ*
FIX*
FTP
ActiveMQ*
AJP
DICOM*
HL7*
LLDP
MSMQ*
Telnet
SMTP
VoIP: SIP*
VoIP: RTCP XR*
Redis*
NFS*
LDAP
VNC
ICMP
STP
HTTP/S
HTTP-AMF
DSCP
iSCSI*
MS-RPC
WebSocket
SSL
SSH
SMPP*
VoIP: RTP*
VoIP: RTCP*
POP3
Memcache*
Kerberos
Syslog
IBM MQ*
SNMP
RDP
ARP
GRE
ICMP6
IEEE 802.1X
IKE
IMAP
IPSEC
IPX
IRC
ISAKMP
LACP
L2TP
MPLS
NTP
OpenVPN
RCoIP
ModBus
*Add-on modules (not included in base license)